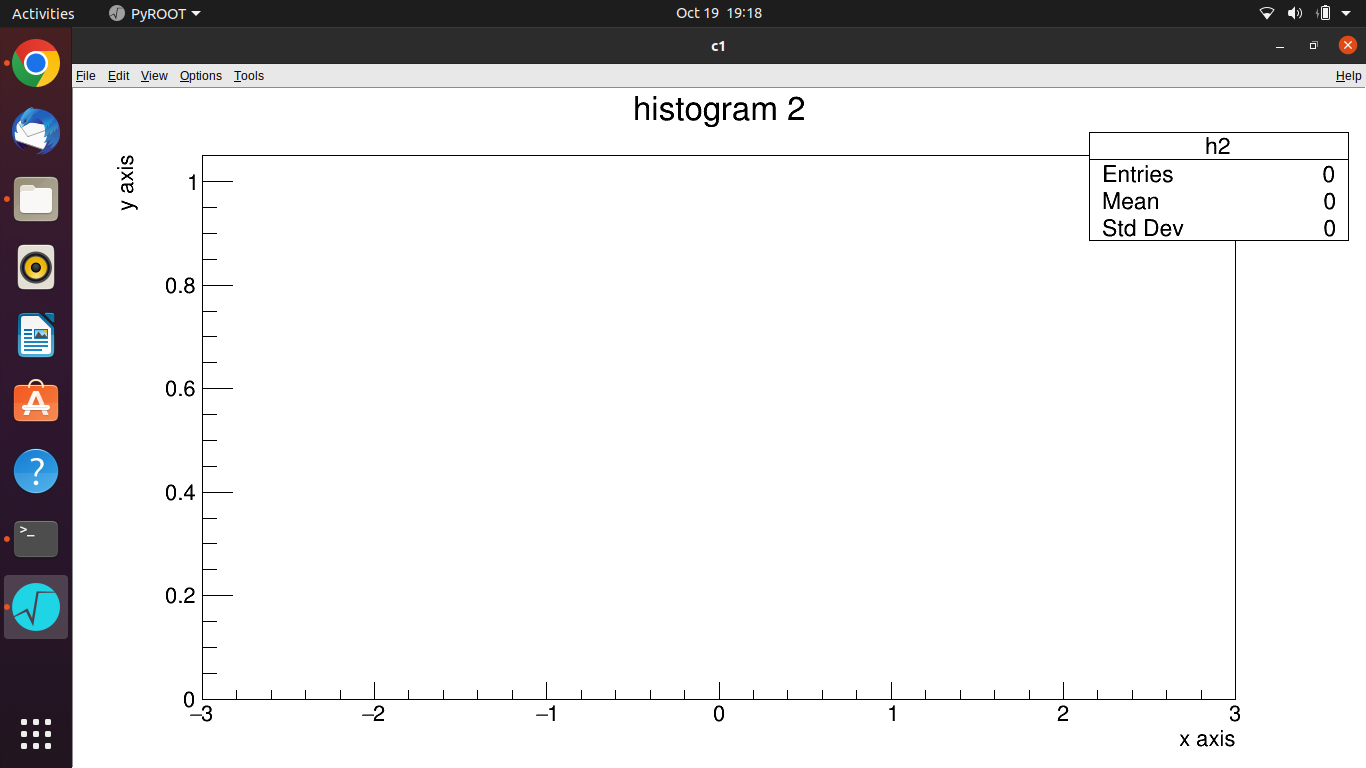
Hi everyone, I’m new to programming, I was learning how to use PyROOT through some tutorials, and I was trying to draw a histogram but it showed just the axis, I need help! ROOT Version: 6.26 Platform: Linux Compiler: Not Provided
here is my code:
import ROOT
import math
c1 = ROOT.TCanvas( 'c1', 'canvas title' )
f = ROOT.TFile( 'my_output.root', 'recreate' )
xbin = 100
xmin = -3.
xmax =  3.
h1 = ROOT.TH1F( 'h1', 'histogram 1; x axis; y axis', xbin, xmin, xmax )
h2 = ROOT.TH1F( 'h2', 'histogram 2; x axis; y axis', xbin, xmin, xmax )
center = 0.1
sigma  = 0.5
for i in range( 10000 ):
...     g = ROOT.gRandom.Gaus(center, sigma)
...     k = ROOT.gRandom.Uniform(-3,3)  # for background.
...     h1.Fill( g )
...     h2.Fill( g ); h2.Fill( k )
h2.Draw()
“KeyboardInterrupt” in your screenshot suggests that you pressed “Ctrl-C”. Then the “for” loop is not executed.
You need to press “Enter” (in an empty line).