I’m trying to differentiate between different regions in a plot by adding a very light hatching to the background. To do this I draw three boxes with a hatching pattern and a light grey fill color, the idea being that the boxes will be sandwiched between the data points and the background of the pad. Unfortunately I can’t figure out how to achieve this. If I draw the boxes before I draw the data then the boxes are obscured (even if I set the canvas fill to transparent) and if I draw the boxes after the data then the hatching obscures the data. Is it possible to work around either of these?
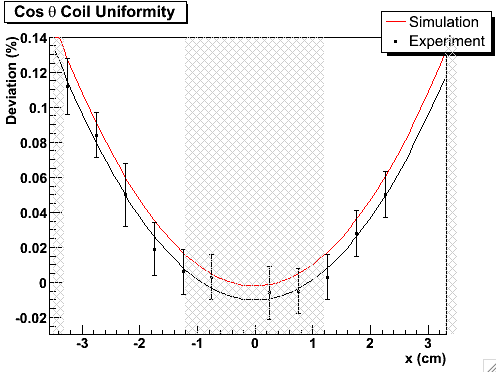
Attached is a copy of the graph I can produce (SetRangeUser doesn’t seem to be working, so the bounds on the x axis aren’t quite right) and the macro.
Thanks for any help.
visualize_x.c (3.62 KB)