Hi,
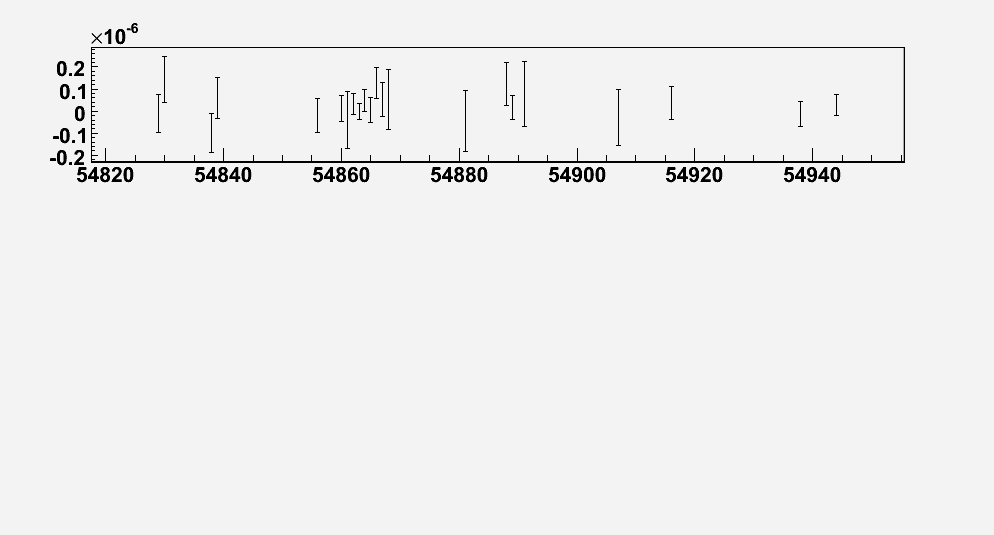
I am trying to make a simple graph. However, half the data points are being hidden by something! OTOH, if you drag the x-axis and squeeze to make the y-scale really small then the points pop-out. Any idea what is going on?
cheers
Erdos
root: 5.18 and/or 5.22
osx 10.4.9
Here is the relevant code:
{
   TCanvas *res = new TCanvas("res", "",399,246,1020,587);
   gStyle->SetOptStat(0);

   TGraphErrors *gre = new TGraphErrors(22);
   gre->SetName("gres");
   gre->SetTitle("");
   gre->SetFillColor(1);
   gre->SetMarkerStyle(21);
   gre->SetMarkerSize(0.5);
   gre->SetPoint(0,54829,-1.214099e-08);
   gre->SetPointError(0,0,8.587511e-08);
   gre->SetPoint(1,54830,1.426971e-07);
   gre->SetPointError(1,0,1.041029e-07);
   gre->SetPoint(2,54838,-9.830536e-08);
   gre->SetPointError(2,0,8.815124e-08);
   gre->SetPoint(3,54839,5.803591e-08);
   gre->SetPointError(3,0,9.290486e-08);
   gre->SetPoint(4,54856,-1.911462e-08);
   gre->SetPointError(4,0,7.808324e-08);
   gre->SetPoint(5,54860,1.310092e-08);
   gre->SetPointError(5,0,5.922739e-08);
   gre->SetPoint(6,54861,-4.050193e-08);
   gre->SetPointError(6,0,1.290179e-07);
   gre->SetPoint(7,54862,3.142436e-08);
   gre->SetPointError(7,0,4.843134e-08);
   gre->SetPoint(8,54863,-2.264908e-10);
   gre->SetPointError(8,0,3.651886e-08);
   gre->SetPoint(9,54864,4.875578e-08);
   gre->SetPointError(9,0,5.139469e-08);
   gre->SetPoint(10,54865,5.126481e-09);
   gre->SetPointError(10,0,5.574954e-08);
   gre->SetPoint(11,54866,1.291114e-07);
   gre->SetPointError(11,0,7.007757e-08);
   gre->SetPoint(12,54867,5.310856e-08);
   gre->SetPointError(12,0,7.593811e-08);
   gre->SetPoint(13,54868,5.099399e-08);
   gre->SetPointError(13,0,1.35526e-07);
   gre->SetPoint(14,54881,-4.473246e-08);
   gre->SetPointError(14,0,1.391323e-07);
   gre->SetPoint(15,54888,1.224478e-07);
   gre->SetPointError(15,0,9.816407e-08);
   gre->SetPoint(16,54889,1.658893e-08);
   gre->SetPointError(16,0,5.636904e-08);
   gre->SetPoint(17,54891,7.839058e-08);
   gre->SetPointError(17,0,1.456443e-07);
   gre->SetPoint(18,54907,-2.879717e-08);
   gre->SetPointError(18,0,1.266287e-07);
   gre->SetPoint(19,54916,3.568971e-08);
   gre->SetPointError(19,0,7.52531e-08);
   gre->SetPoint(20,54938,-1.369235e-08);
   gre->SetPointError(20,0,5.715767e-08);
   gre->SetPoint(21,54944,2.665325e-08);
   gre->SetPointError(21,0,4.749541e-08);


   gre->Draw("A p");
   res->Modified();
   res->Update();
   res->cd();

}