Hi Rooters,
I’m trying to plot a THStack made of TH2I histograms. My issue is that I cannot use GetZaxis() on the THStack because this function is not defined in the class: https://root.cern.ch/doc/master/classTHStack.html. Thus, I cannot do something like:
h_stack->GetZaxis()->SetTitle(“Events”);
Is this a mistake in the class definition linked above, or am I using the wrong command to set the title? I found that if I open my canvas in interactive mode, I can right click on the axis and change it manually. However, this is very impractical.
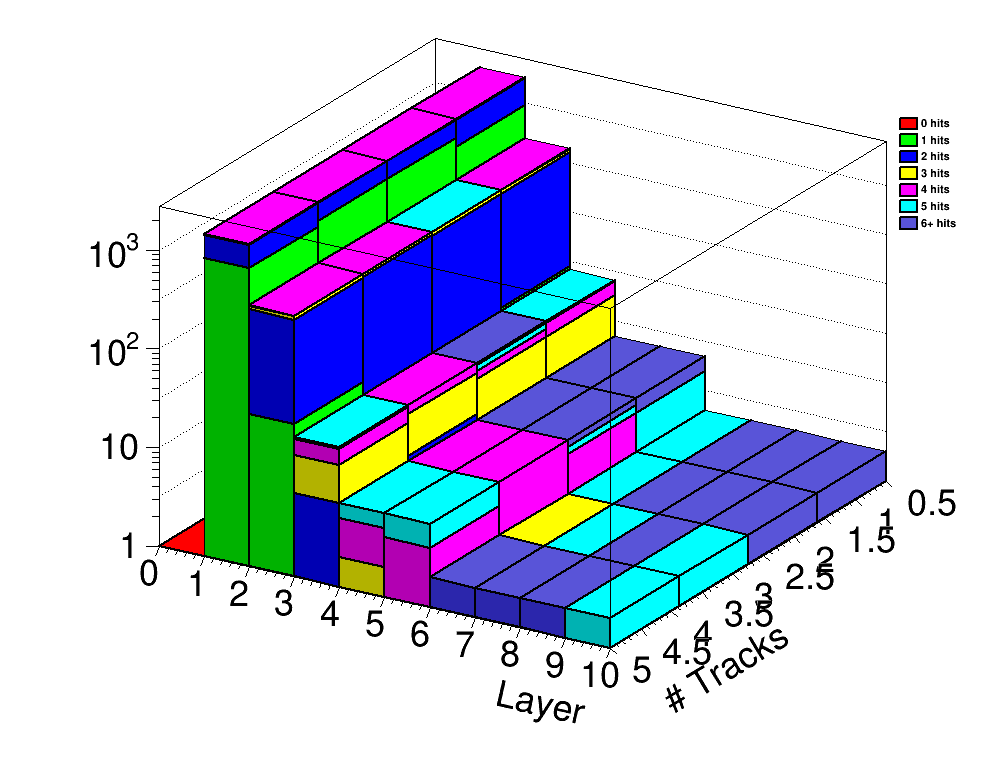
Side question, to anyone who might know: I’d like to remove numbers that contain a “.5” in the x-axis of my histogram (seen below). Can this be done, and if so, how?
Thanks for your time,
Felix