Getting the last entry of a TTree


ROOT Version: 6.18/04
Platform: 18.04
Compiler: cc 7.5.0 (Ubuntu 7.5.0-3ubuntu1~18.04)


Dear co-rooters,

I’m trying to read the last entry (row?) of a TTree.
What I do is getting the total number or entries using TTree::GetEntries() and then TTree::Scan() to read that entry. What I get however, is nothing.

Any idea on what I might be doing wrong?

root [1] DICER->GetEntries()
(const Long64_t)3218822773
root [2] DICER->GetEntry(3218822773)
(Int_t)0
root [3] DICER->GetEntry(3218822772)
(Int_t)73
root [11] DICER->Scan("*", "Entry$==3218822772")
************************************************************************************************************************************************************************
*    Row   * ntof.ntof * detn.detn * event_ID. * Q_short.Q * Q_long.Q_ * RunNumber * ntof0.nto *       PSD *    paddle * beam_bloc * baseline. * std_basel *    dt_min *
************************************************************************************************************************************************************************
************************************************************************************************************************************************************************
==> 0 selected entries
(Long64_t)0

Try

DICER->Scan("*", "", "", 1, 3218822772);

[Corrected type where a period was inadvertently used instead of a comma]

Thanks for the reply!
It does print something!

root [3] DICER->Scan("*", "", "", 1, 3218822772)
************************************************************************************************************************************************************************
*    Row   * ntof.ntof * detn.detn * event_ID. * Q_short.Q * Q_long.Q_ * RunNumber * ntof0.nto *       PSD *    paddle * beam_bloc * baseline. * std_basel *    dt_min *
************************************************************************************************************************************************************************
* 3218822772 * 8.471e+11 *         1 *    153656 *        21 *     65535 *     46661 *         0 * 0.9996795 *        Cd * both_open * 14710.599 * 1.7928817 *    -1e+10 *
************************************************************************************************************************************************************************
(Long64_t)1

So here comes the issue then: I want to check the possible values of a TBranch for example the RunNumber. So what I do is draw a histogram as follows:

root [5] DICER->Draw("RunNumber>>h(776, 45885.5, 46661.5)", "", "histo")

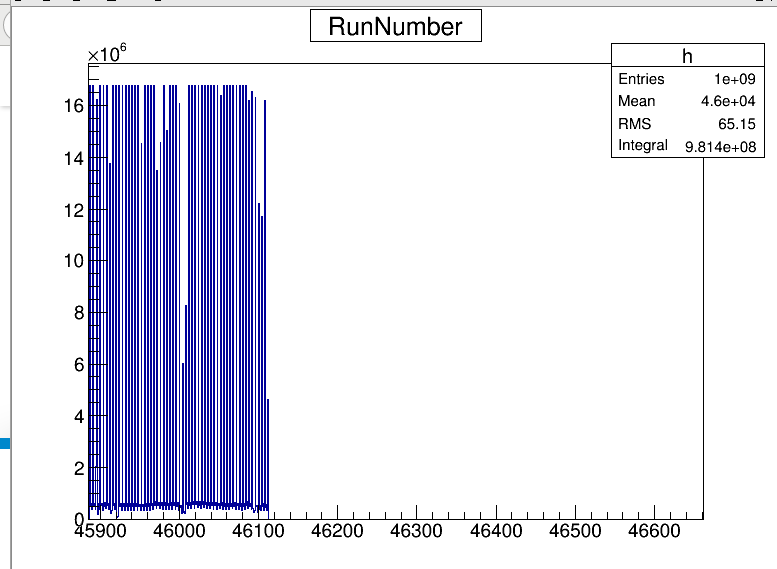
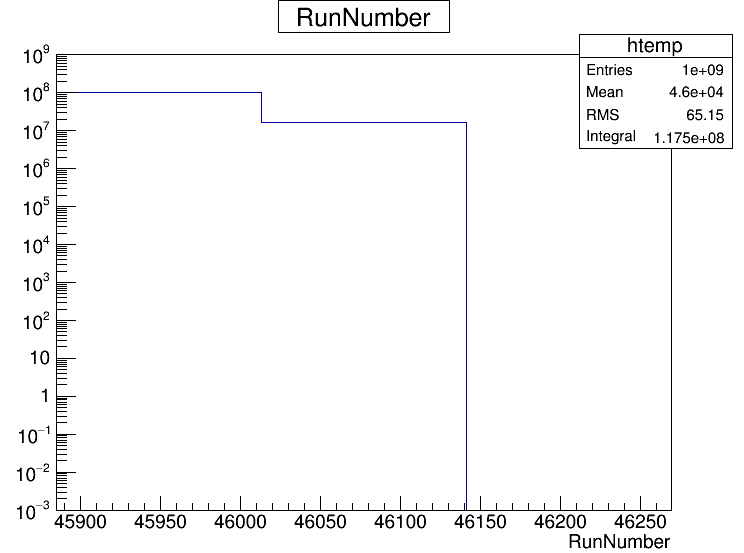
I know that RunNumber goes from 45886 to 46661. For some unknown reason the histogram has zero entries after a RunNumer; not always the same but around 46115 so I suspect a memory issue in the interpreter.

Any idea on that?

I did the same as you when drawing and it works!

root [6] DICER->Draw("RunNumber>>h(776, 45885.5, 46661.5)", "", "histo", 3218822772, 1)

Why is that though?
I never had to use the number of entries or the first entry when scanning or drawing.

Well in your original post, you ask how to print the data for a specific entry (and it applies to drawing also).

I assume that you mean that the result of the drawing of the last entry give the expected result and you are wondering why that result do not appear when you draw the full tree.

And indeed you should be getting all the data plotted … and if your dont this means that there is some “different” in you case. So let investigate.

What are the full set of command that lead to the “incorrect” histogram?

What you try with “less” customization (it should have worked the way you had it but we are trying to find out what is going wrong):

DICER->Draw("RunNumber);

(Especially if this also fails), can you run the failing example with valgrind:

valgrind --suppressions=$ROOTSYS/etc/valgrind-root.supp root.exe -l 
....

Cheers,
Philippe

Thanks a lot for your help!

So if I just do DICER->Draw("RunNumber") I get the following

If I do DICER->Draw("RunNumber>>h(776, 45885.5, 46661.5)", "", "histo") I get something similar but with a different binning

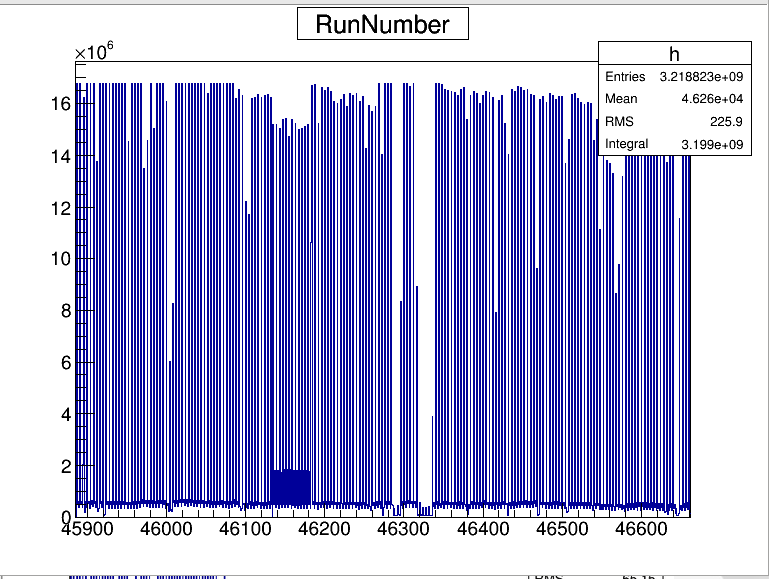
If I do DICER->Draw("RunNumber>>h(776, 45885.5, 46661.5)", "", "histo", 3218822772, 1) I get what I’d expect to get without specifying any entries whatsoever.

I’m trying to run the same with valgrid but it takes a lot of time.

Even with valgrid I don’t see a smoking gun

$ valgrind --suppressions=$ROOTSYS/etc/valgrind-root.supp root.exe -l
==208908== Memcheck, a memory error detector
==208908== Copyright (C) 2002-2012, and GNU GPL'd, by Julian Seward et al.
==208908== Using Valgrind-3.8.1 and LibVEX; rerun with -h for copyright info
==208908== Command: root.exe -l
==208908== 

root [0] TFile *_file0 = TFile::Open("runs_45886_46661_4mm_147Sm_12p5mg_CdPolyNone.root")
root [1] DICER->Draw("RunNumber")
Info in <TCanvas::MakeDefCanvas>:  created default TCanvas with name c1

root [2] 
root [2] .q
==208908== 
==208908== HEAP SUMMARY:
==208908==     in use at exit: 14,370,070 bytes in 112,606 blocks
==208908==   total heap usage: 397,216 allocs, 284,610 frees, 123,647,007 bytes allocated
==208908== 
==208908== LEAK SUMMARY:
==208908==    definitely lost: 89 bytes in 4 blocks
==208908==    indirectly lost: 0 bytes in 0 blocks
==208908==      possibly lost: 14,399 bytes in 37 blocks
==208908==    still reachable: 11,029,145 bytes in 74,437 blocks
==208908==         suppressed: 3,326,437 bytes in 38,128 blocks
==208908== Rerun with --leak-check=full to see details of leaked memory
==208908== 
==208908== For counts of detected and suppressed errors, rerun with: -v
==208908== ERROR SUMMARY: 0 errors from 0 contexts (suppressed: 6696 from 176)

humm … I recommended:

DICER->Scan("*", "", "", 1, 3218822772);

i.e. Draw 1 entry starting at entry number 3218822772.
while you reported on

DICER->Draw("RunNumber>>h(776, 45885.5, 46661.5)", "", "histo", 3218822772, 1)

i.e. Draw 3218822772 entries starting at entry number 1.

Since you are getting almost the right behavior with that tweaks (the broken case draws only the 1st one billions entries), I think the following should work for you:

DICER->Draw("RunNumber>>h(776, 45885.5, 46661.5)", "", "histo", DICER->GetEntries(), 0)

Now that is supposed to be the default, so it is weird :frowning:

Can you also try with:

DICER->SetEstimate(DICER->GetEntries());
DICER->Draw("RunNumber>>h(776, 45885.5, 46661.5)", "", "histo");

and also try you original attemps with a new version of ROOT (6.24/00 for example).

The magic “1e+09” value is the default “Long64_t nentries = 1000000000” parameter value used in old versions of ROOT. Maybe you should double-check the version you are actually using.

Check also: DICER->GetMaxEntryLoop()

Then, many bins have their content equal to something like “16.777216e6”. That suggests that they are “TH1F” histograms, and they reached a known precision limit. You need to switch to “TH1D” histograms.
In the “${ROOTSYS}/etc/system.rootrc” file, change (or create your private “${HOME}/.rootrc” file):

# Default histogram precision for TTree::Draw(). It can be 'float"or "double"
Hist.Precision.1D:           float
Hist.Precision.2D:           float
Hist.Precision.3D:           float

into:

# Default histogram precision for TTree::Draw(). It can be 'float"or "double"
Hist.Precision.1D:           double
Hist.Precision.2D:           double
Hist.Precision.3D:           double

That was the issue!
For unknown reasons nor related to root, a module was loaded that changes the root version to 5.32.

I’m sorry about the mess and thanks for your help!