I have a 2d histogram that I would like to draw as col or colz, but I want to have the color axis be in a log scale. I have tried basically every order and permutation of the following code (moving things around, commenting out and uncommenting), but none have worked.
It’s probably something else in your code.
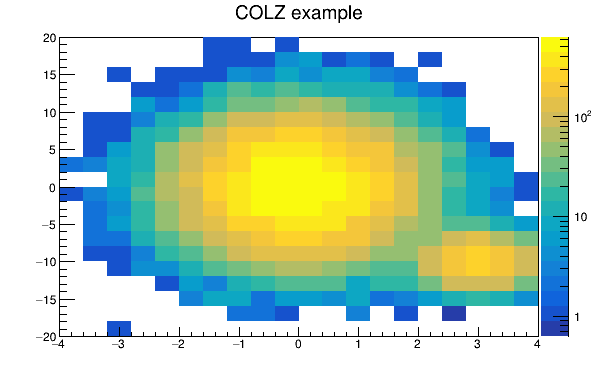
This works for me:
{
   auto c1   = new TCanvas("c1","c1",600,400);
   auto harr = new TH2F("harr","COLZ example",20,-4,4,20,-20,20);
   harr->SetStats(0);
   float px, py;
   for (Int_t i = 0; i < 25000; i++) {
      gRandom->Rannor(px,py);
      harr->Fill(px,5*py);
      harr->Fill(3+0.5*px,2*py-10.,0.1);
   }
   c1->SetLogz();
   harr->Draw("COLZ");
}
Check if you get the same with this example. If not, it’s more helpful if you post the code you are using, or a minimal example code showing what you get.