Hello all,
This might be a difficult and weird question, but it is thoroughly beating me.
So, what I am doing is building a program for analyzing angular correlations for neutron capture nuclear structure experiments.
For doing this, I am extracting the angular correlation shape (done successfully), fitting it to obtain the A2 and A4 parameters (done successfully), and then using these to obtain the mixing ratios based on some spin hypothesis.
In all cases where at least one of the spins is 0, it is very simple (as at least one of the mixing ratios is 0) and I can easily extract the other.
However, when I have no spin equal to 0, and thus two mixing ratios, I managed to get to the point where I obtain a TGraph2D of what is basically the Chi2, but it is a very non-trivial shape that cannot just be fitted with a paraboloid.
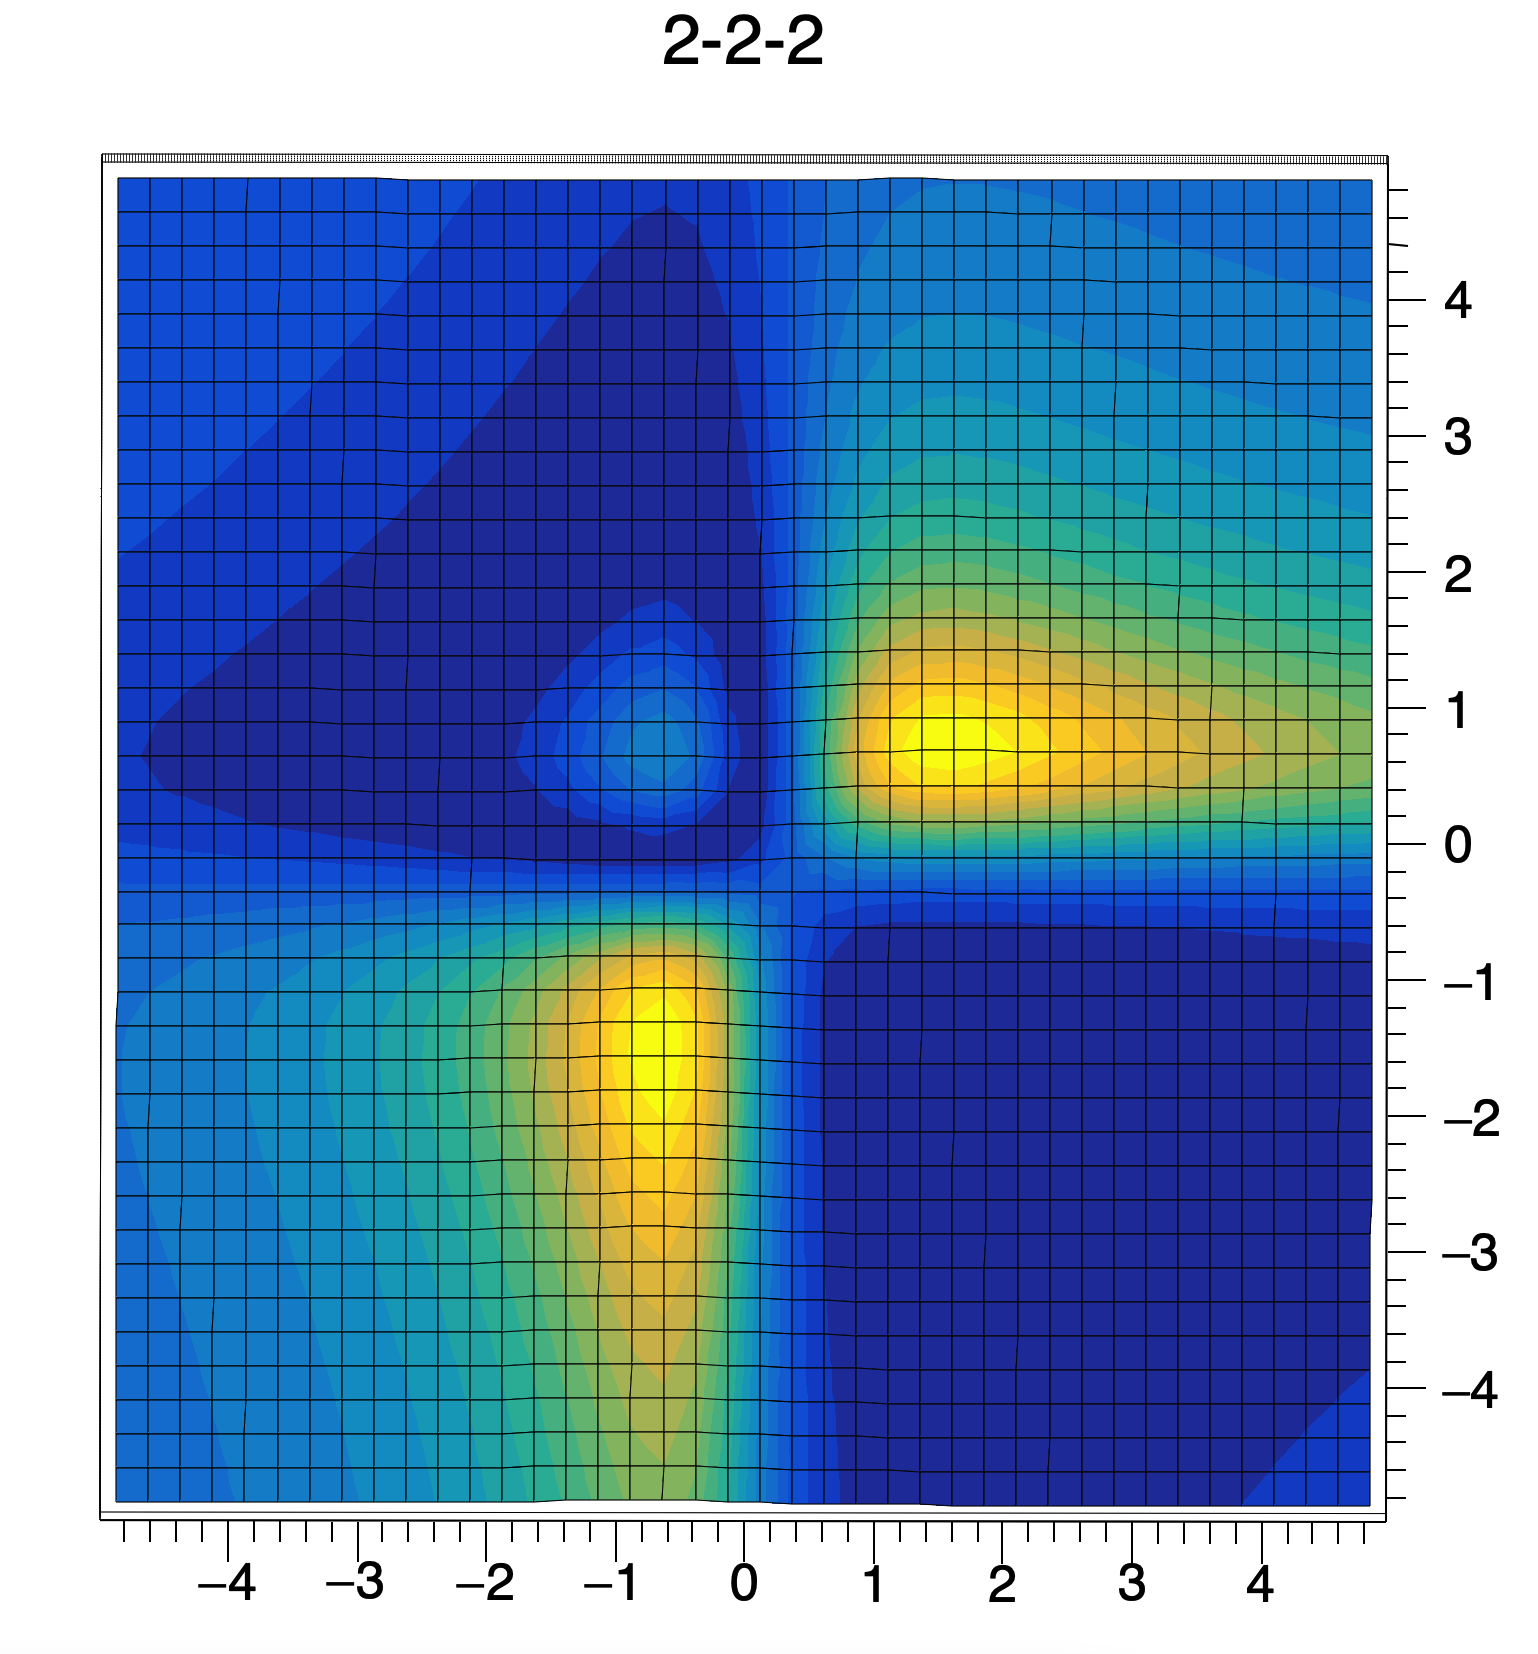
Basically, everything that is dark blue is Chi2<1.0 and is an acceptable value. However, I have absolutely no idea how I can describe this.
An idea I have received is somehow describing the contours of the Chi2<1.0 areas, but I do not know how to obtain this. Any ideas? Thank you!