I’m trying to make some plots with TGLParametricEquation, and with the help of root experts this advances well. Boosted by my success I decided to try TEve. Now, to plot my TGLParametricEquation in TEve I do
TEveManager::Create();
TEvePlot3D *x = new TEvePlot3D(equationname);
x->SetPlot(pe,"");
gEve->AddElement(x);
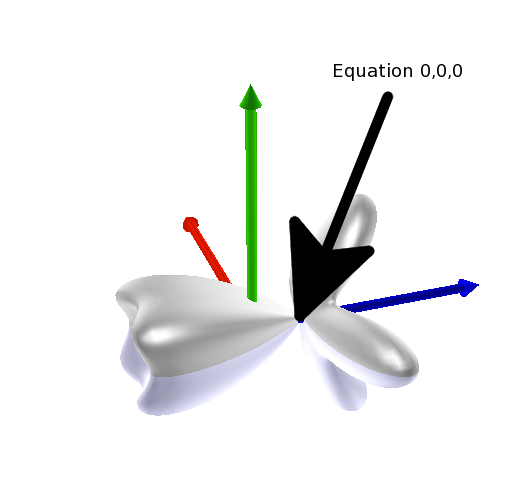
where “pe” is the TGLParametricEquation. This works fine, expect that TEve puts the center of the Bounding box at 0,0,0, and not the 0,0,0 of my equation. So I need to figure out the transformation to do and for this I need the corners of the bounding box of TEvePlot3D.
Or some other, better solution to my problem
cheers
Joa
ps
I include a small picture to make my problem a bit clearer
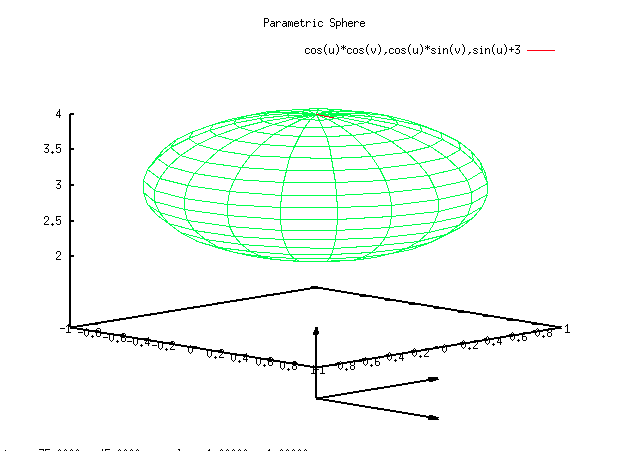
I guess I was to vague about what I want, so I try with an other example. First, here is sphere drawn with gnuplot, shifted 3 units along the z axis, and with arrows of one unit along the x,y, and z axis. I include a script to do it with.
[attachment=2]Screen shot 2011-12-13 at 4.09.00 PM.png[/attachment]
set parametric
set isosamples 20,20
set hidden3d
set title “Parametric Sphere”
set urange [-pi/2:pi/2]
set vrange [0:2*pi]
splot cos(u)*cos(v),cos(u)*sin(v),sin(u)+3
set arrow 1 to 1,0,0
set arrow 2 to 0,1,0
set arrow 3 to 0,0,1
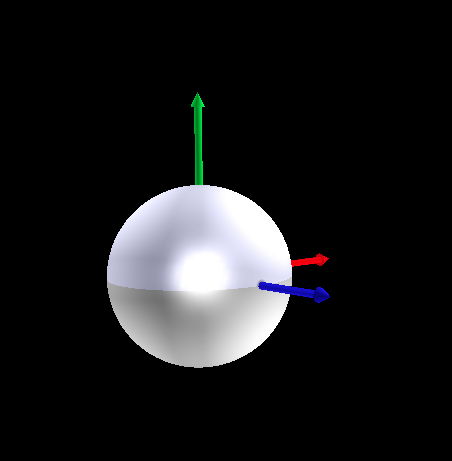
Then I try to do the same with TEve and I get
[attachment=1]Screen shot 2011-12-13 at 4.09.14 PM.png[/attachment]
using this macro
[attachment=0]tglparametric.C[/attachment]
Now, what I don’t understand and can’t find information about is how TEve relates the coordinates of the TGLParametericEquation with its own. I guess TEve scales and transforms some kind of bounding box given by TEvePlot3D so that the center of this bounding box is at 0,0,0 and its sides are 1. Can I get this information so that I can translate/transform the TEvePlot3D as I want? Or do I have to recalculate this “bounding box”?
As you already figured out, EVE scales 3D plots into a unit cube. For all EVE objects you can set TEveTrans … a homogenous coordinate transform (rotation + translation in 4x4 matrix). root.cern.ch/root/htmldoc/TEveTrans.html
Take a look at tutorials/eve/glplot_geom.C … there the transformation is set for a plot so that it fits together with some detector geometry.
Other than that I should warn you that the 3D plots in Eve are not fully supported – we did a preliminary implementation to see how it looks and then, unfortunately, never had the time to do it right all the way through.