Hi all,
I would like to fix the range of input variables for the signal and background both in AddVariable. For that I can see here (link) that there is an option for adding min and max. But its not working.
Is this min and max is for setting the range of input variables?
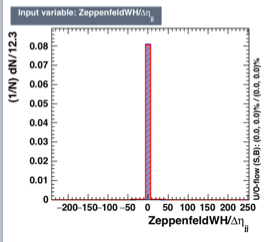
Please let me know how I can fix the range because of the range issue the seperation rank on one of my important variable is zero. Since all the events fall in only one bin such that there is no difference in the signal and background.
Let me summarize once again. I would like to squeez the range of input variables and add all the overflow events in the last bin so that I won’t loose any events.
Thanks in advance for help.
with regards,
Ram
Hi,
Could you describe your situation a bit more? E.g. what method are you using when you get these results.
The input data is not generally binned, and the output is neither. However some histograms are binned for convenience. It might be that for some reason the method is not picking up on the differences in the variable. Perhaps a pre-training transformation can help? It’s hard to say without more information.
To manually do what you describe, loop over the data and and clamp the values for that variable to your specified maximum. To my knowledge there is no automatic way of doing this in TMVA 
Cheers,
Kim
Dear @kialbert,
Thanks for looking into my issue.
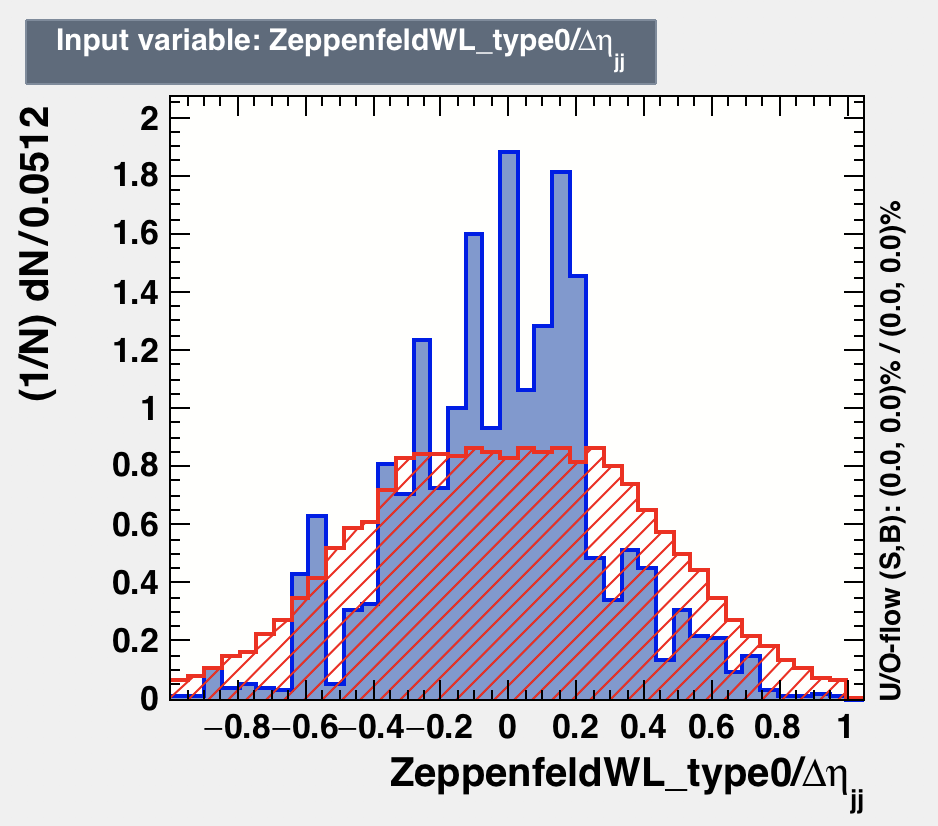
I am using BDTG for my training. My input variables are branches of tree. One of variable looks like [2]. But, when we fix the range (-1,1) then the signal and background are really discriminating. But, with present situation the variable importance value is zero for the variable shown in [2]. You can look at my coder here [1].
If this is not possible to change the range then here (link) what’s the function of min and max?
Thanks & regards,
Ram
[1] TMVAClassification.C (48.6 KB)
[2]
The binning of the plot should really not impact the performance of the BDTG as it operates on unbinned data.
For visualisation you could try changing the fNbinsMVAoutput variable of the global TMVA Config object. E.g. adding
TMVA::Config::Instance().fNbinsMVAoutput = 200;
at the top of your file.
Cheers,
Kim
Hi @kialbert ,
I think the binning of plot impacts the traning because if you look at the distribution [1]. So, this has a lot of discreminating power as we can see. But, TMVA gives me variable importance rank value equal to 0. I may assume that after looking at the all other distributions it decides but I have several other variables that are very less discriminating than the distribution [1] while its importance rank value is > 0.
If you want I can post more details with all my distributions, rank and other details. Let me know if you would like to see those.
Also, I tried your suggestation for changing the bin but it did not worked. I tried two things:
First I added line:
 74    TMVA::Tools::Instance();
 76    (TMVA::gConfig().GetVariablePlotting()).fNbinsMVAoutput=20;
and then I added line:
 74    TMVA::Tools::Instance();
 76    (TMVA::gConfig().GetVariablePlotting()).fNbinsMVAoutput=200;
But in both case the binning of all distribution does not changed at all, i.e. with 20 and 200 I got identical bins. Is the method of my implementation was correct? Or should I add something else for this?
with regards,
Ram
[1]
Hi,
Can the algorithm do any work with only that variable?
I do not have access to your input files for the moment, so I cannot reproduce the results locally.
Cheers,
Kim
Dear @kialbert,
Sorry, I missed this message.
Thanks for suggestation.
no it does not work. Behaves same.
You can see my code here: GitHub - osWW-VBS/TMVA_Studies
presently there is cut applied for ZeppenfeldWL_type0/detajj (-1,+1). So if you want to reproduce then you have to remove that cut.
You can grab input files from path:
at Lxplus:
/afs/cern.ch/user/r/rasharma/work/public/aQGC_Ntuples/WWTree_2017-11-26_18h59
at fnal:
/store/user/rasharma/SecondStep/WWTree_2017-11-26_18h59/HaddedFiles
One thing that I just realised is that this variables has lots of NANs. So, is there a possibility that because of NANs its behaving like this??? But, there is 2-3 more variables that has this issue but there distribution looks fine and also there ranking.
with regards,
Ram