Hi @smgrig @Wile_E_Coyote ,
Thanks a lot for your comments and suggestions. I changed the for loop to this:
for (int i = 1; i <= N; ++i)
and I tried to draw a spline with this:
   TSpline3 *s = new TSpline3("Spline",Summation);
   s->SetLineColor(kRed);
   s->Draw("same");
The result is shown below:
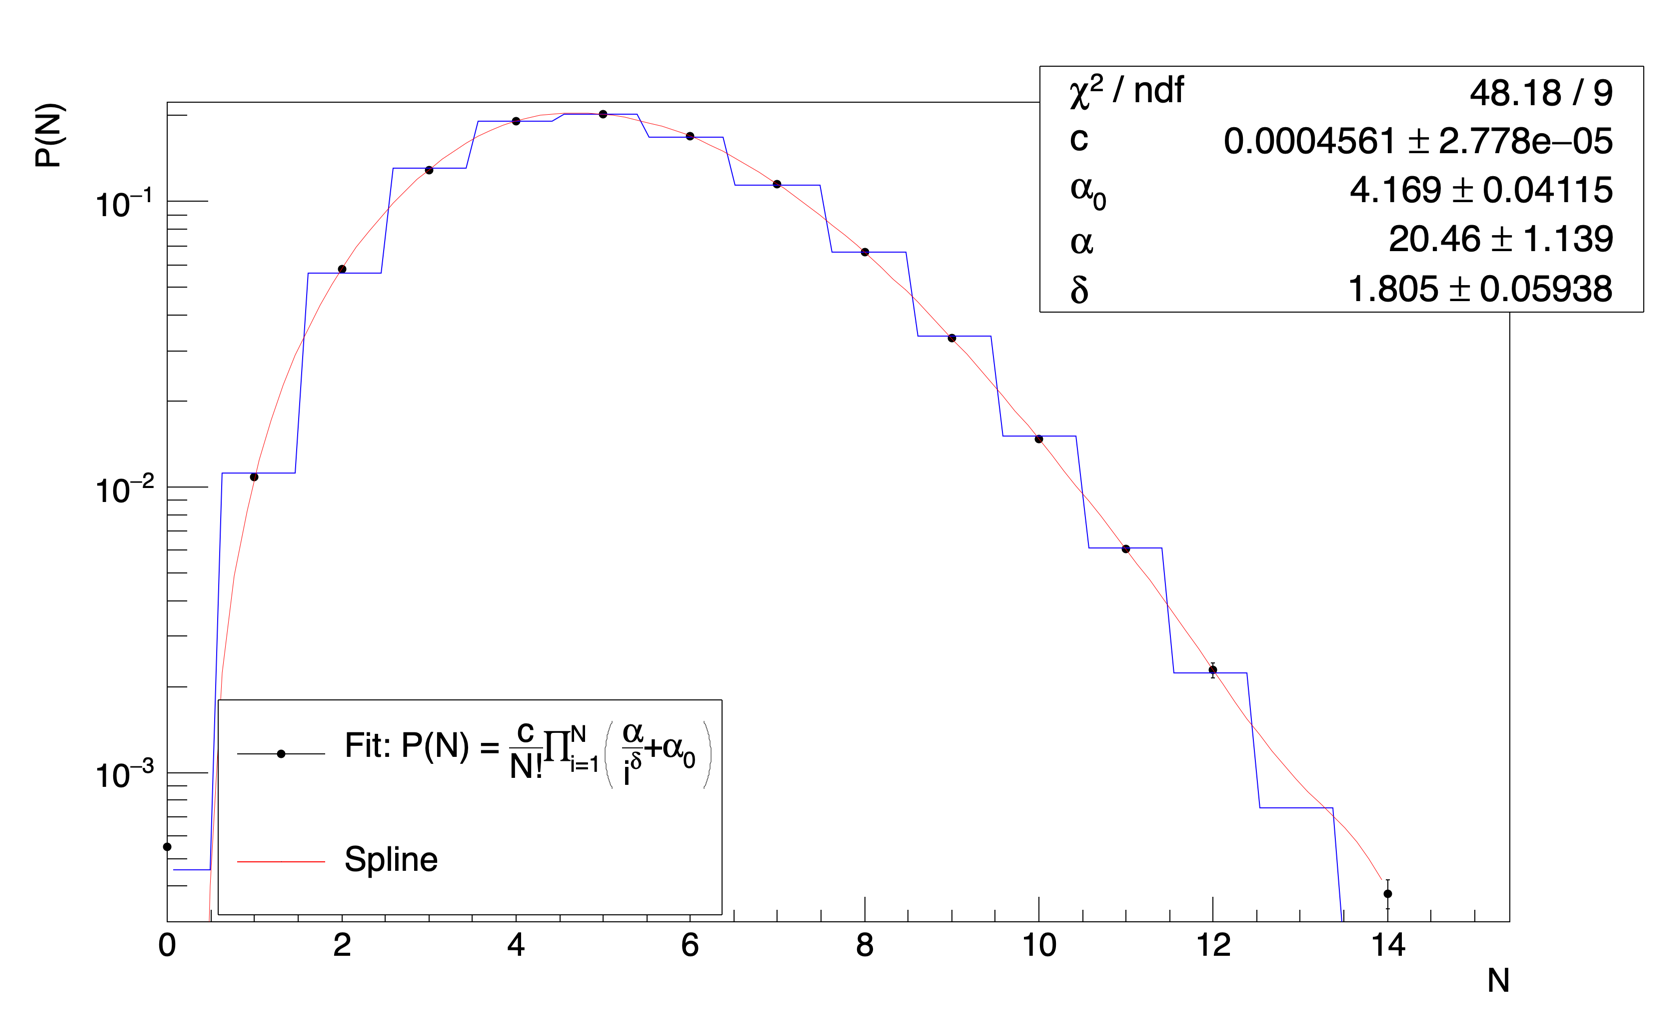
P(0) is not actually a data point but is obtained from the extrapolation of a model to N =0. But I think the issues with my fitting are solved now.
Thank you ![]()
Rahul