Fitting polynomial using roofit

I’m trying to do something quite simple in vain. Basically, I’m trying to fit 6th order polynomial to my histogram using Roofit.

Without Roofit, I would do this:

  hh.Fit("pol6","", "", 100, 250);
  hh.Draw();

and it would work nicely. However, with roofit,

  TFile* file=m172500;
  file->Print();  TH1* hh=file->Get("trigger_cum/Dilepton_Mlb");
  RooRealVar x("x", "Mlb",0, 250);
  RooDataHist data("data", "", x, hh);

  RooRealVar a0("a0", "", 0.166, -100, 100);
  RooRealVar a1("a1", "", -0.027, -10, 10);
  RooRealVar a2("a2", "", 0.0015, -10, 1); 
  RooRealVar a3("a3", "", -2.12741e-05, -1, 1); 
  RooRealVar a4("a4", "", 1.26994e-07, -1, 1); 
  RooRealVar a5("a5", "", -3.4875e-10, -1, 1); 
  RooRealVar a6("a6", "", 3.62884e-13, -1, 1); 

  Pol6  fpol6("p", "", x, a0, a1, a2, a3, a4, a5, a6);
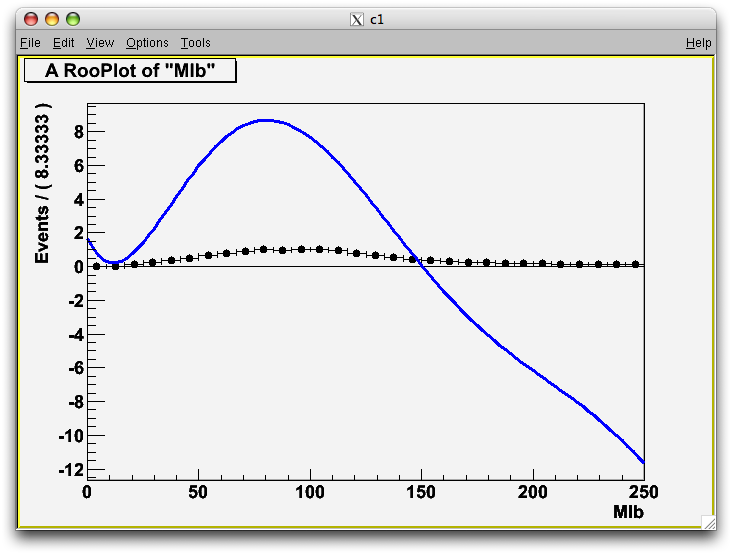
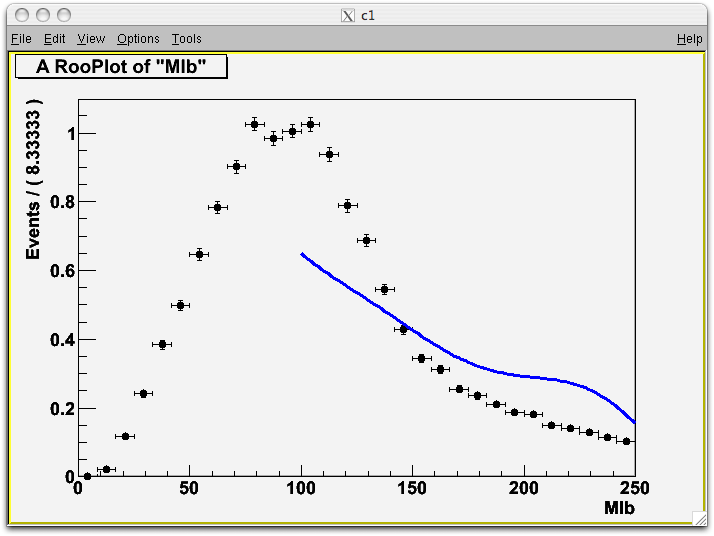
  fpol6.fitTo(data, Range(0, 250), Extended(kTRUE));

After a bunch of error messages like

[quote][#0] WARNING:Plotting – At observable [x]=212.5 Pol6::p[ x=x a0=a0 a1=a1 a2=a2 a3=a3 a4=a4 a5=a5 a6=a6 ]
p.d.f value is less than zero (-0.733092), forcing value to zero @ x=x=212.5, a0=a0=0.166 +/- 84.147, a1=a1=-0.027 +/- 8.41468, a2=a2=0.0015 +/- 2.65917, a3=a3=-2.12741e-05 +/- 0.841471, a4=a4=1.26994e-07 +/- 0.841471, a5=a5=-3.4875e-10 +/- 0.841471, a6=a6=3.62821e-13 +/- 0.841471
[/quote]

I get a rather poor result as shown in the picture. I think I’m doing something very wrong but I cannot figure what it is. Would you please help understand what’s going on?

Thanks
Akira
hh.root (4.14 KB)


BTW, I defined Pol6 to be RooAbsPdf with

Double_t Pol6::evaluate() const
{
// ENTER EXPRESSION IN TERMS OF VARIABLE ARGUMENTS HERE
return a0+a1x+a2xx+a3xxx+a4xxxx+a5xxxxx+a6xxxxx*x ;
}

I also tried with RooPolynomial but the result was equally bad (very different though).

Hi Akira,

The function you define in ROOT and RooFit are different, because the latter is a probablity density function and the former is not.

A polynomial describing a probability density function always has one degree of freedom less than a plain polynomial function because of the constraint that the integral over the observables equals one. This can particularly affect functions where there are parameters that explicitly control the ‘vertical scale’ (polynomials)

If you ignore that in your pdf formulation (as is the case in Pol6) you end up with an unconstrained degree of freedom and MINUIT will terminate without converge (and a bad fit results). For that reason RooPolynomial by default writes pdfs as (1+a0x+a1x^2), which doesn’t have that problem, but may not describe all shapes well (especially those that vanish at x=0).

I suggest you try to use a standard chebychev polynomial, which is much more stable and converges well in most cases.

RooChebychev cpol(“cpol”,“cpol”,x,RooArgList(a0,a1,a2,a3,a4,a5,a6))

Wouter

PS: You are encouraged to post your RooFit questions on the ‘Stats & Math’ forum of ROOT

Hi Wouter

Many thanks for your help as always.

(I’ll post future questions related to statistics in the other category you suggested but for now I’ll use this thread.)

I understand that pdf has to have a unit area but if that is so, RooChebychev you suggested would also have the problem because my histogram is not normalized to unity.

Besides, maybe I’m don’t understand it well but wouldn’t extended likelihood formalism enable one to fit without this constraint? Or in that case should I have said that my polynomial was a*Pol6 ?

I tried [quote] RooPolynomial fpol6(“p”, “”, x, RooArgList(a0, a1, a2, a3, a4, a5, a6));
RooProdPdf fpol6_n(“pn”, “”, x, RooArgList(a, fpol6));
fpol6_n.fitTo(data, Range(100, 250), Extended(kTRUE));
[/quote]

but the result was not better than before.

I did try Chebychev and I seem to fit much better as attached. I still get a bunch of error like

[quote][#0] WARNING:Plotting – At observable [x]=11.875 RooChebychev::p[ x=x coefList=(a0,a1,a2,a3,a4,a5,a6) ]
p.d.f value is less than zero (-0.022400), forcing value to zero @ x=x=11.875, coefList=(a0 = 0.139706 +/- 0.603153,a1 = -1.60938 +/- 0.808847,a2 = 1 +/- 0.920953,a3 = -0.0305949 +/- 0.572437,a4 = -0.14977 +/- 0.516649,a5 = -0.199864 +/- 0.564941,a6 = 0.288584 +/- 0.455598)
[/quote]

with or without Extended(kTrue), it says that this pdf does not support extended ml, so maybe that’s why (but then again, why would it fit at all despite the constraint of pdf==1?)

Really I’m interested in the region between 100 and 250, so I set the range but now I end up with much less plausible result as attached also.

Am I still doing things wrongly?