Hi,
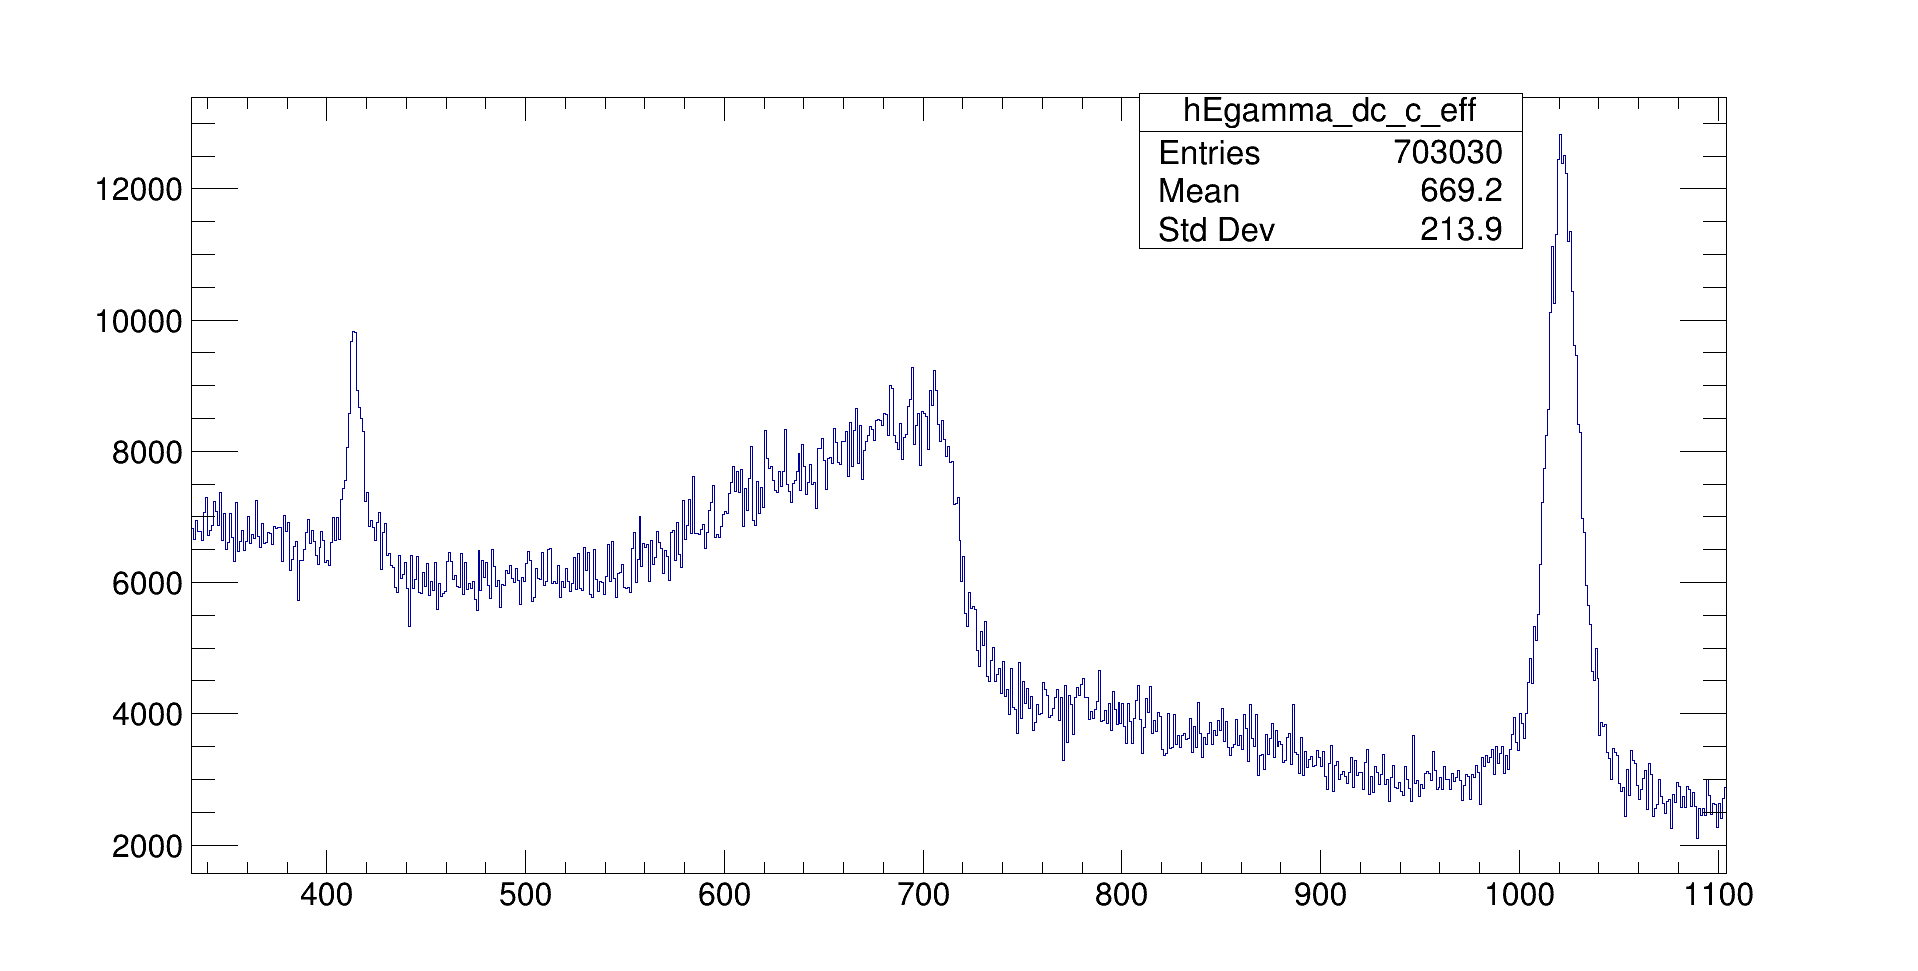
I have the following energy spectrum. I would like to fit the peak lying in the energy range 500 - 800 keV. I am not sure what function would best fit the peak and the background. I would like to extend the background from 430 to 1000 keV. I tried pol1 for the background and gaus for the peak but it didn’t work. Could anyone give any comments or suggestions? I have attached the histogram also.
hEgamma_dc_c_eff.root (32.5 KB)
Hi @Mustak_Ali , that line shape from 600 → 750 keV is due a resonance decay thereby
resulting in a Breit-Wigner. Fit this histogram with a Gauss around 420, a Breit-Wigner around 700 and again a Gaussian line shape around 1025. The background looks linear.
-Eddy
Apologies for my delayed response.
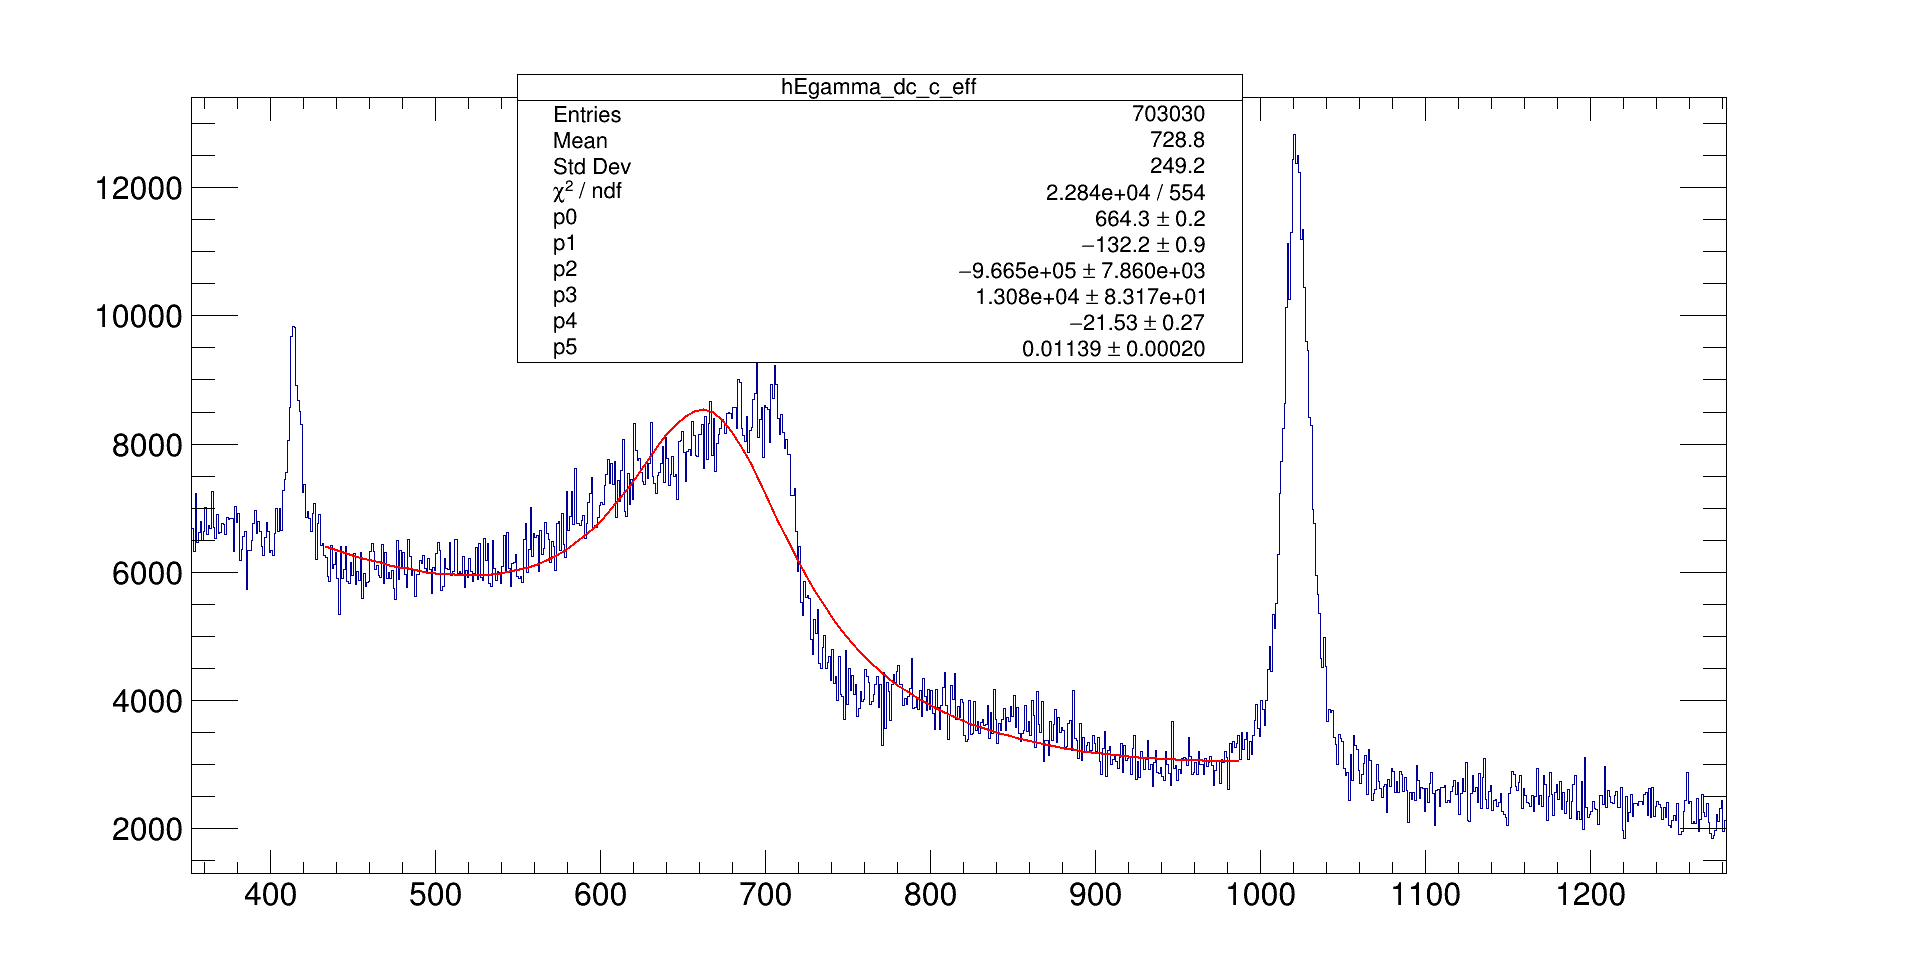
Thanks a lot for your comments @Eddy_Offermann ! I had tried to fit the peak with multiple gaussians and for the background I used a quadratic fit. But I am going to use Breit-Wigner for the 718 keV peak.
These multiple Gaussians would be odd. The detector resolution is given by the peak at 420 and 1025.
Hi @Eddy_Offermann,
Are there any inbuilt Breit-Wigner functions available in ROOT?
Have a look at BeitWigner
Hi @Eddy_Offermann ,
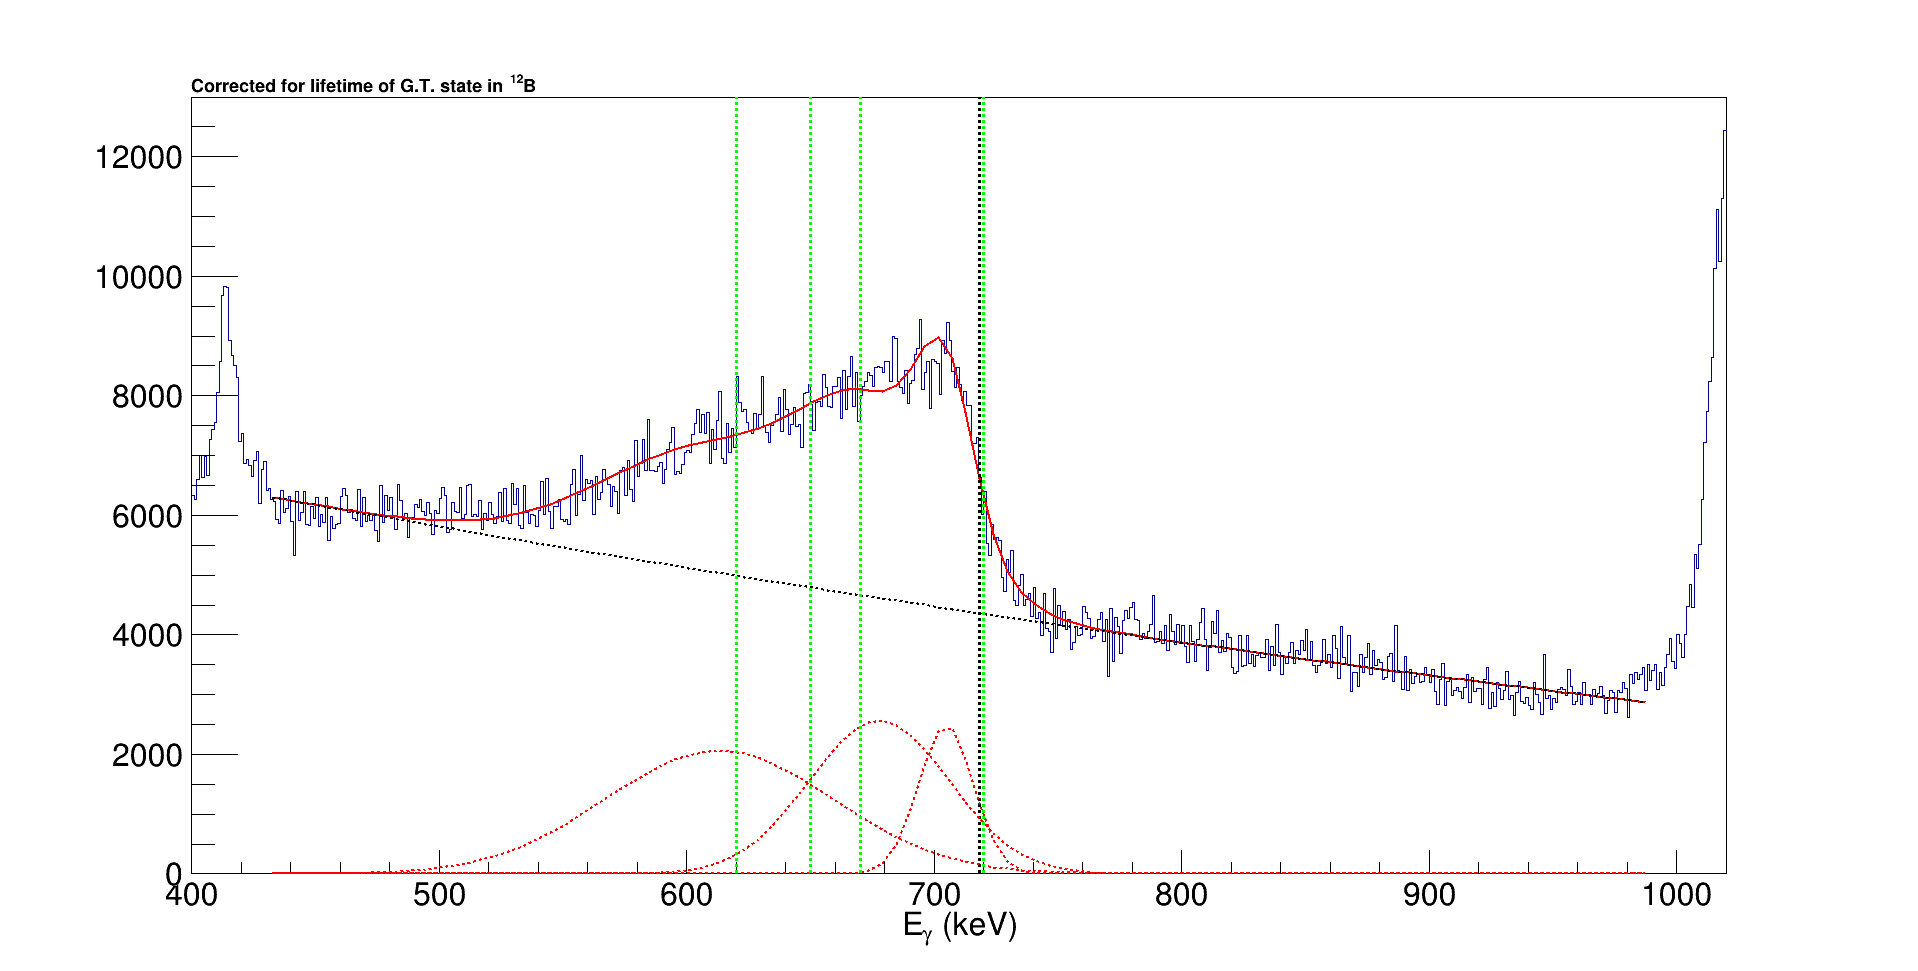
I tried to fit using Breit-Wigner+quadratic background. But the fit isn’t nice. I attach both the macro and the plot here. Any suggestions what am I missing?
fit_GT_gamma_BW2.C (1.4 KB)
Best regards,
Mustak
Here I have attached the histogram.
hEgamma.root (32.5 KB)
This root file does not contain a histogram, only a TCanvas
Hi @Eddy_Offermann,
If you open the canvas with TBrowser you can see the histogram.
I have now saved the histogram in a root file. You can find it just by opening the root file attached.
Thank you.
output.root (22.9 KB)
Reminding myself a bit more about gamma spectroscopy, this 700 bump is probably due to Compton scattering, see overview of gamma spectroscopy. Its line shape will depend very much on your experimental setup.`
Hi @Eddy_Offermann,
The broad peak at ~ 0.7 MeV is due to the decay of the 10B(1+,0.718 MeV) → 10B(3+,gs). It is broad because of its half-life of 0.71 ns and the decay occurs over an extended distance after the target. This distorts the gamma-ray angle measurement and the Doppler reconstruction.
good, so it is a decay with a large half-life and therefore a Breit-Wigner line shape. Just puzzling why the right side is so steep, not like a Breit-Wigner. Can this limit on the gamma-ray angle be the explanation, aka what folding function makes it so steep ?
Yes, the steep right side of the peak is not typical of a simple Breit-Wigner line shape. I am not sure what folding function makes it so steep.