I have a measured spectrum saved as a TH1D in a ROOT file and I have a few simulated spectra also saved as TH1Ds in a number of ROOT files.
I’m hoping to fit the simulated spectra to the measured spectrum, i.e.: my fitting function should look like [0]*simulated_spec_0 + [1]*simulated_spec_1 + …
The fitted spectrum should then be drawn onto the canvas and the fitting parameters ([0], [1], [2], …) should then be written in a txt file.
Could anyone point to me the correct way I should go about tackling this task (esp. the histogram fitting part)? From what I’ve seen(or understood from the documentation), there seem to be no method to fit TH1D objects, only TF objects, or am I mistaken?
I don’t quite understand what you mean by Step 2: to fit the simulated spectrum, I would need to have the experimental spectrum opened already so that there would be something to fit the simulated spectrum onto, no?
And how would one go about fitting the TH1*? If I understand the code in “myfit.C”, the imported histogram (hpx) is in a TF1 format, not a TH1* format. Would the same method work?
In myfit.C, “hpx” is a TH1F object (it corresponds to the blue line on the figure). And you fit it using “func” that is a TF1 object (it is the red line on the figure).
About the rest, could you attach a picture to see how both simulated and experimental spectra look like?
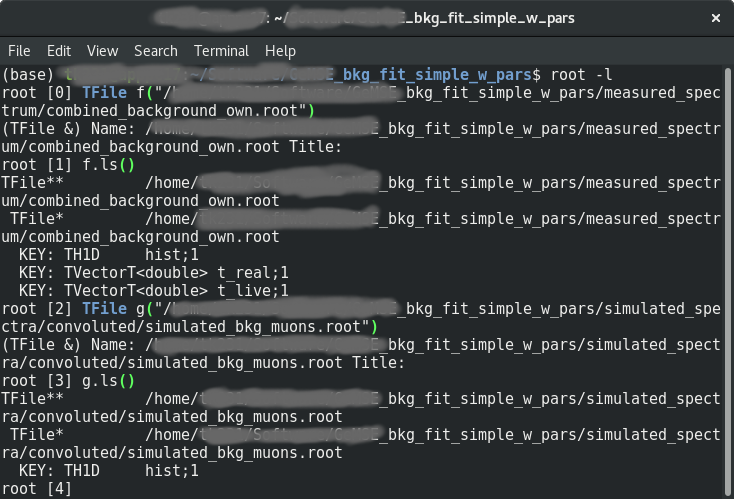
Hi, sure. I attached the screenshot I have from my ROOT terminal (I thought that it would be more helpful with the file types there, or should I attach the histograms drawn?")
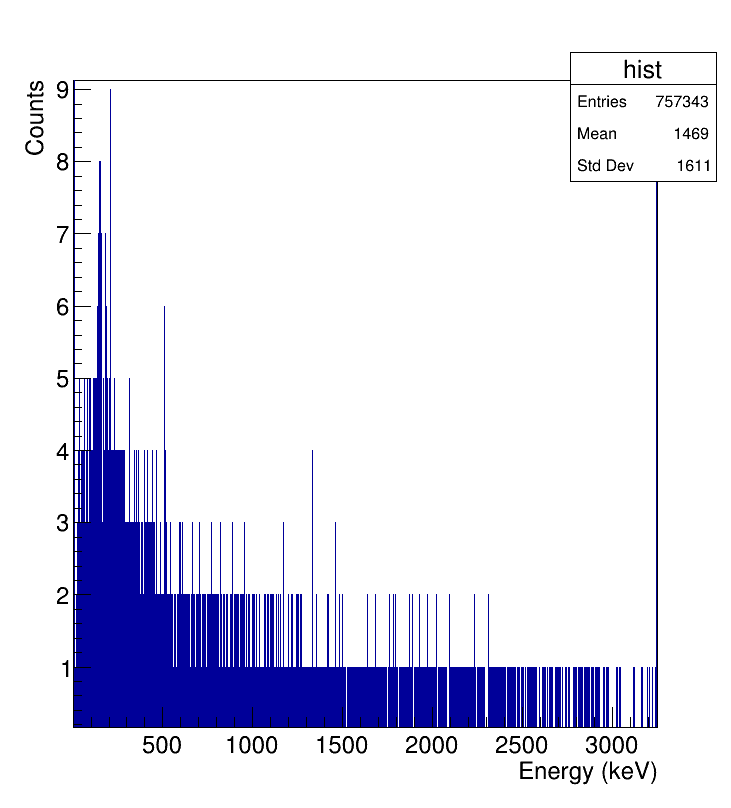
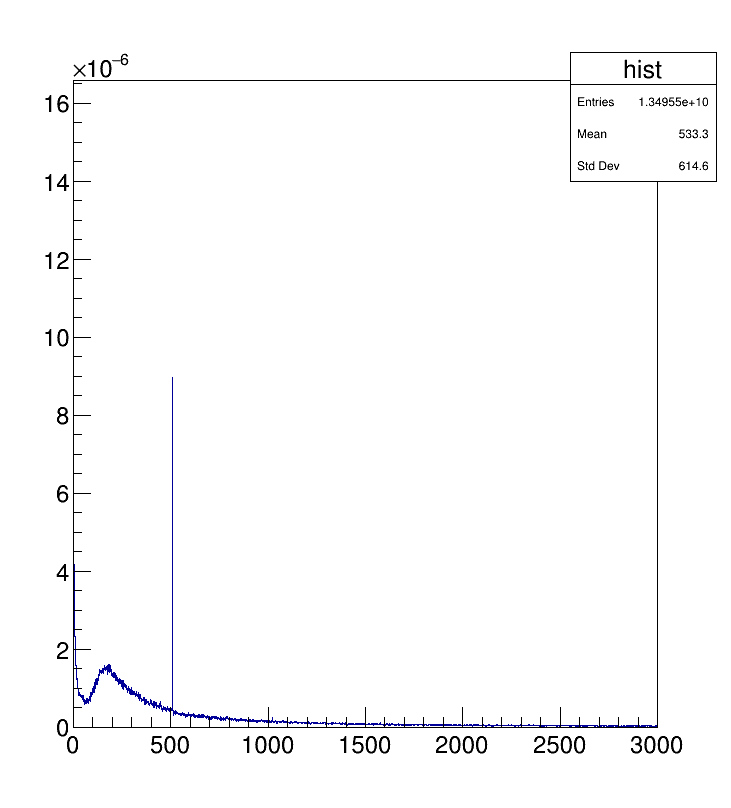
my bad: the bottom is the simulated data and the above one is the measured spectrum.
I would ideally like to learn to scale the bottom TH1D .root file to best fit the one above. As you might already infer, this is where the other spectra would come into play. My goal is to, in the end, be able to read off from the fit parameters the contribution of each spectra (which corresponds to a certain radioisotope) after the fit has been applied.
I know it might sound a bit superficial after so many instances, but I can’t help myself from thanking you again for your patience and willingness to help!
If all your simulated spectra contain only one peak so it is rather easy to fit them with a Gaussian like in the myfit.C tutorial. Indeed, you need to find the maximum of the histogram to find the position of the peak. If more than 1 peak is present, you will need to use a peak search algorithm (see ShowPeaks for example).
And then, you can follow the steps I described above.
About the step 2, the idea is to determine the parameters of the Gaussian peak with which you fitted your simulated spectrum. And at the end, you can set these parameters for a global fit of your experimental spectrum (the position and the width of the peak should not change that much; only the amplitude is free).
ooof, I think I haven’t worded what I wanted to do properly.
My idea of a “fit” was to fit one TH1D onto another TH1D (i.e.: comparing both the histograms with each other and determine, for example, that the simulated histogram = 10e6 * measured histogram), and not fitting a curve onto it. My apologies if that’s not the correct wording for it (would appreciate learning the correct term).
Ok, in that case, you do not need to use TF1. You find the height of a the peak you are interested in in your experimental spectrum using the GetBinContent method. You do the same on the simulated spectrum. You can now compute the ratio of the two heights and using the Scale method, you can achieve what you want.
Is it important in this case that both histograms have the same limits (I assume so)? And since I have a number of other spectra, which all have different scale factors, how would one go about obtaining the correct scale factor for all the other spectra?