Hi ROOTers,
I acquired some IV curve and im trying to fit them using a combination of linear and parabola fit. The macro used
bool reject = false;

double splitline(const double *x, const double *p) {
  // y = a + b * (x - x0) + c * (x - x0) * (x - x0)
  double x0 = p[0]; // "point of split"
  double a = p[1]; // "left" and "right" (linear and parabolic)
  double b_left = p[2]; // "left" (linear)
  double b_right = p[3]; // "right" (parabolic)
  double c_right = p[4]; // "right" (parabolic)
  double dx = x[0] - x0;
  // when fitting, exclude points which are close to the "point of split"
  if (reject && (dx > -1.075) && (dx < 0.3)) // note: asymmetric range, change it in order to obtain the best chi squared
    TF1::RejectPoint();
  return (a + ((dx < 0.) ? b_left : b_right + c_right * dx) * dx);
}

void hamamatsu(const char *fname = "1_inversa.txt") {
  if (!(fname && fname[0])) return; // just a precaution

  TGraphErrors *g = new TGraphErrors(fname);
  if (!(g->GetN())) return; // just a precaution
  g->Sort(); // just a precaution
  g->SetTitle("Curve I-V;Reverse-bias [V];Current [nA]");
  g->GetXaxis()->SetNdivisions(1925);
  g->GetYaxis()->SetNdivisions(748);

  TCanvas *c = new TCanvas("c", "Curve I-V");

  c->SetFillColor(0);
  c->SetBorderMode(0);
  c->SetBorderSize(2);
  c->SetFrameBorderMode(0);
  c->SetGrid(1, 1);
  c->SetTicks(1, 1);
  c->SetLogy();

  gStyle->SetOptFit(000); // 111 per vedere i parametri di fit

  TF1 *f = new TF1("f_splitline", splitline, g->GetX()[0], g->GetX()[(g->GetN() - 1)], 5);


  f->SetParNames("x0", "a", "b_left", "b_right", "c_right");
  f->SetNpx(8000);
  // note: one should always set "reasonable" initial values for all parameters
  f->SetParameters((g->GetX()[0] + g->GetX()[(g->GetN() - 1)]) / 2., g->GetY()[0], 0., 0., 0.);
  // f->SetParameters(50., 0.1, 0., 10., 10.);
#if 0 /* 0 or 1 */
  // try to make the fit more "robust" (when initial parameters are not good)
  // f->SetParLimits(0, g->GetX()[0], g->GetX()[(g->GetN() - 1)]); // x0
  // f->SetParLimits(1, 0., 1000.); // a >= 0
  f->SetParLimits(2, 0., 1000.); // b_left >= 0
  f->SetParLimits(3, 0., 1000.); // b_right >= 0
  f->SetParLimits(4, 0., 1000.); // c_right >= 0
#endif /* 0 or 1 */

  reject = true;
  g->Fit(f, "QN"); // first "initial pre-fit"
  g->Fit(f, "QN"); // second "initial pre-fit"
  g->Fit(f, "QN"); // third "initial pre-fit"
  g->Fit(f, "QN"); // fourth "initial pre-fit"
  g->Fit(f, ""); // "final fit"
  reject = false;

  g->Draw("ALP");


}
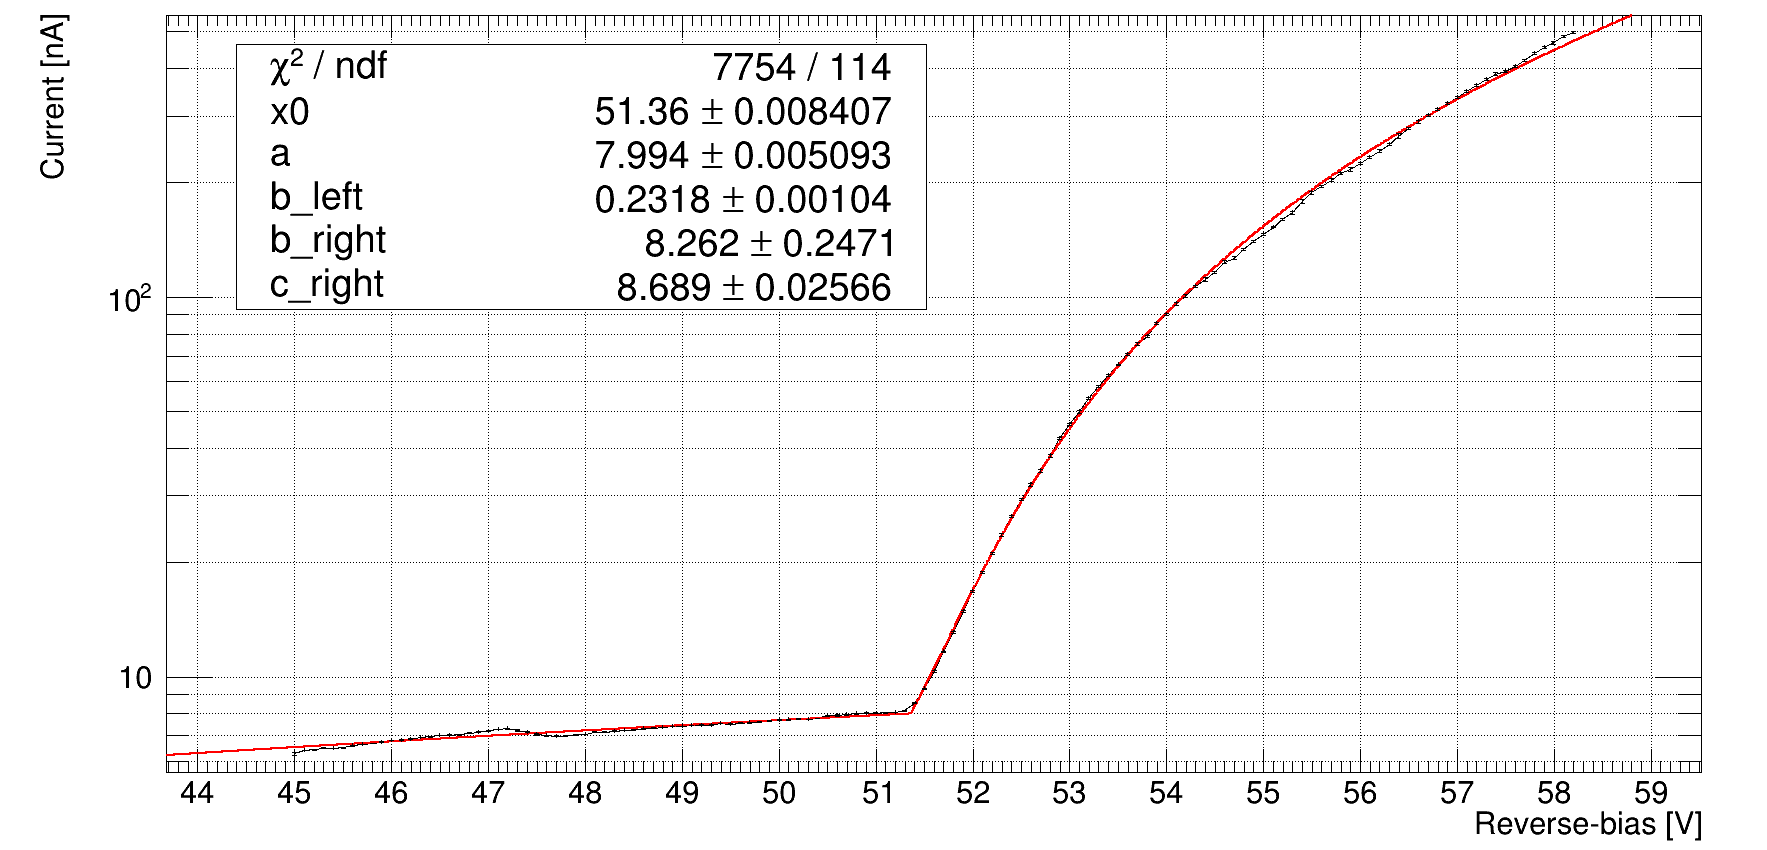
works perfectly for some kind of curve like HPK_S13_anode10_25C_inv.txt (6,5 KB):
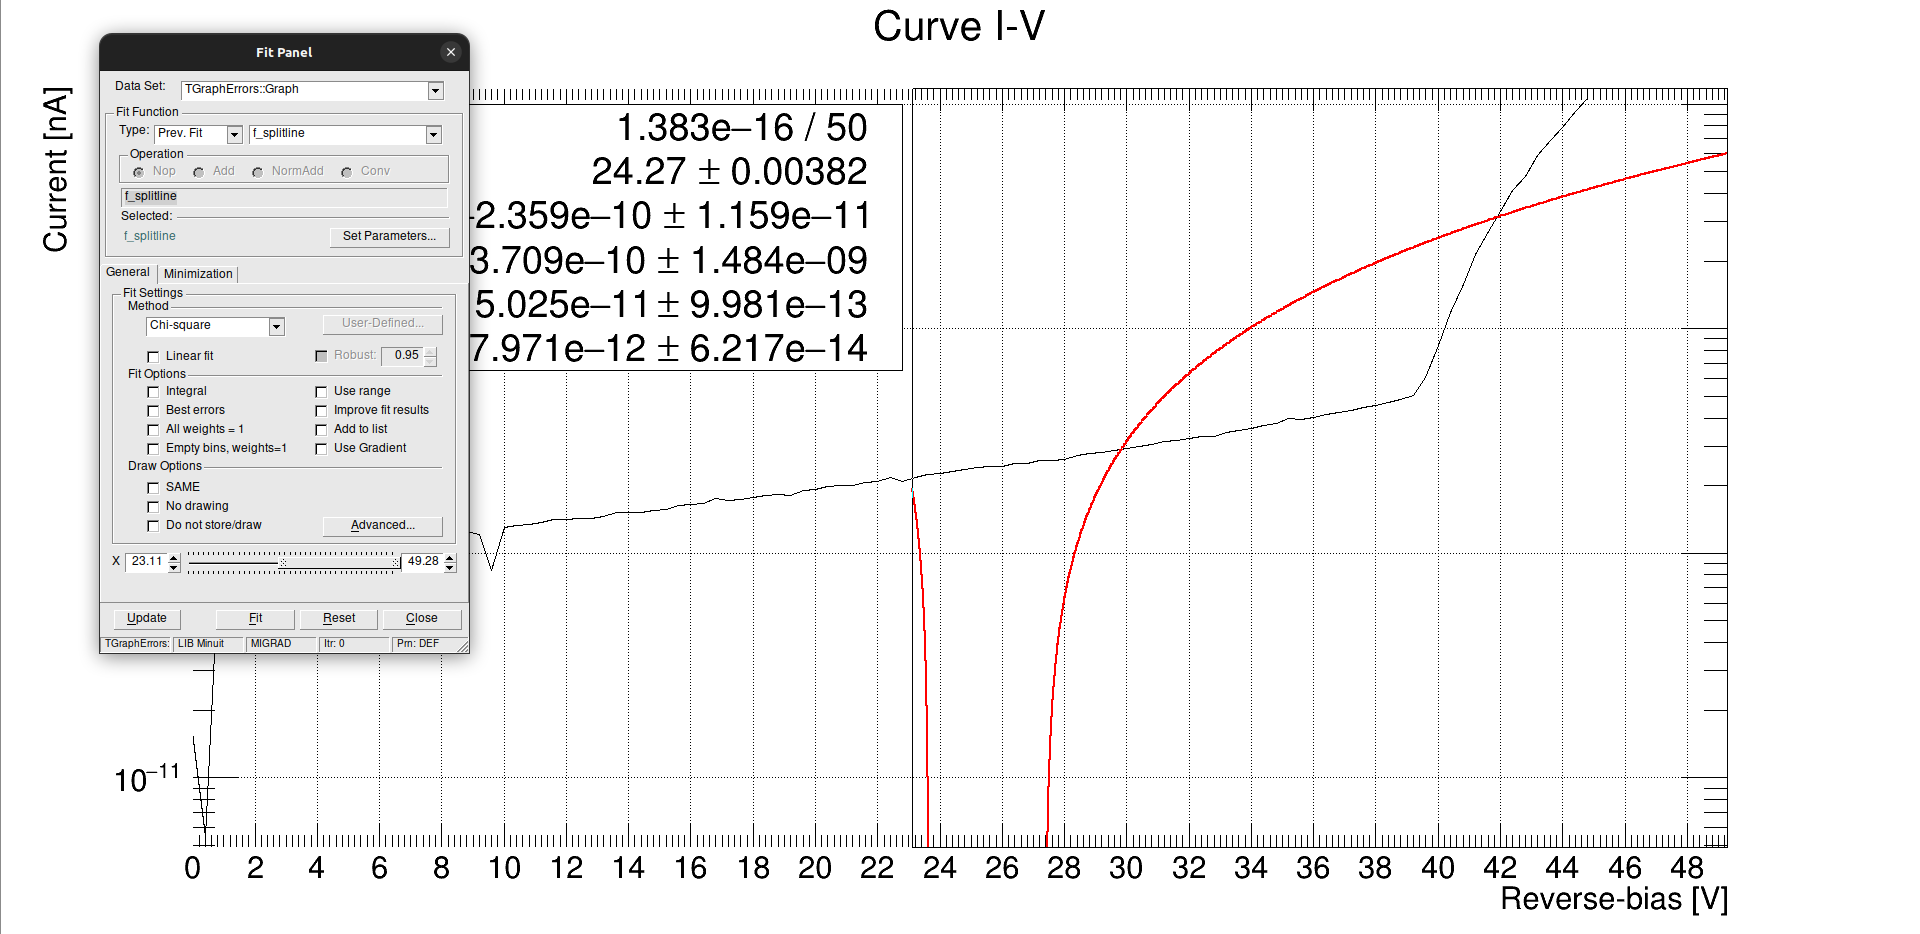
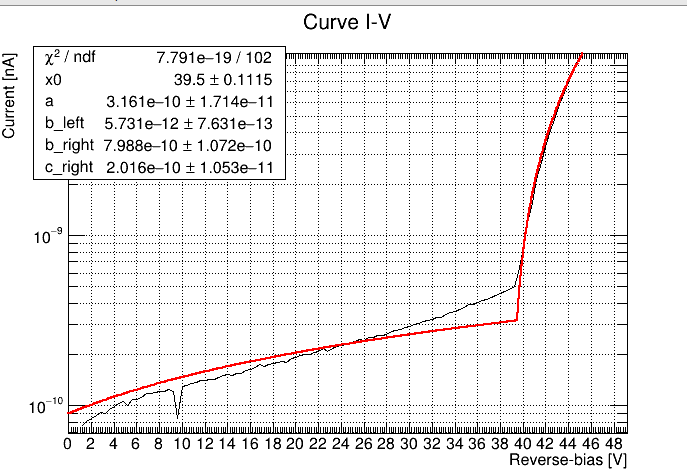
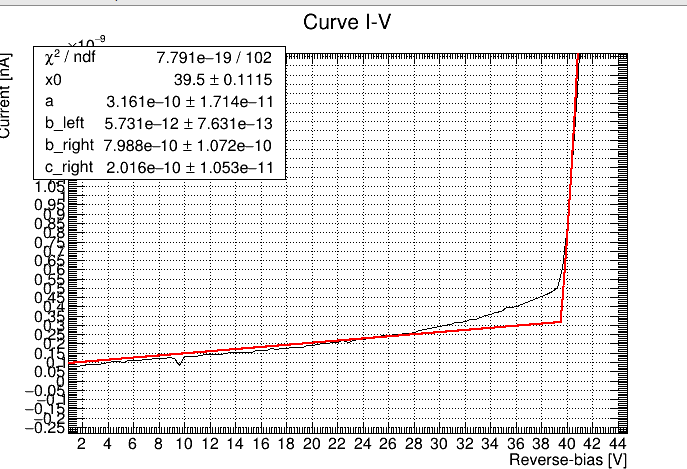
but not the same for another kind of IV curve like Ch1_inv.txt (3,2 KB):
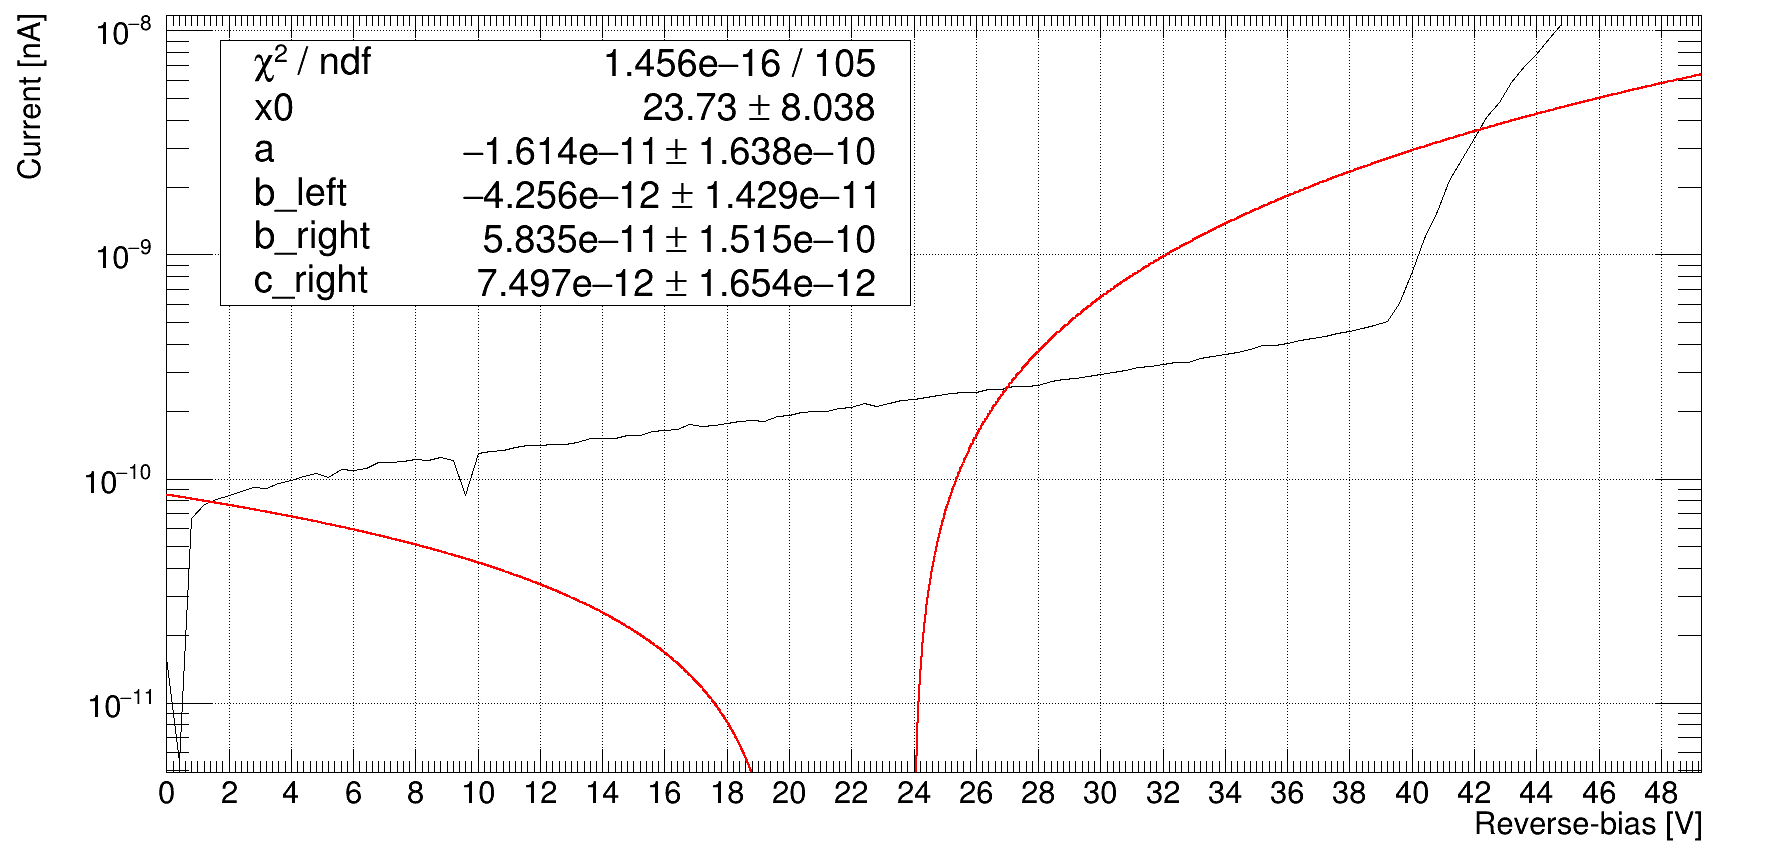
Someone can help me please?