Dear Experts,
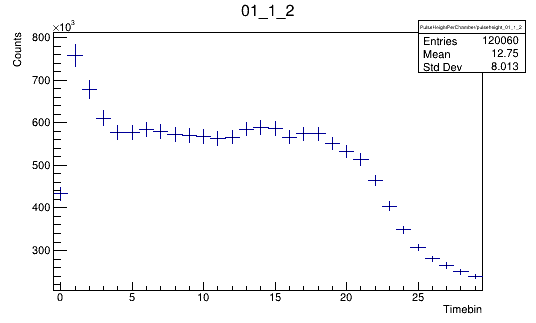
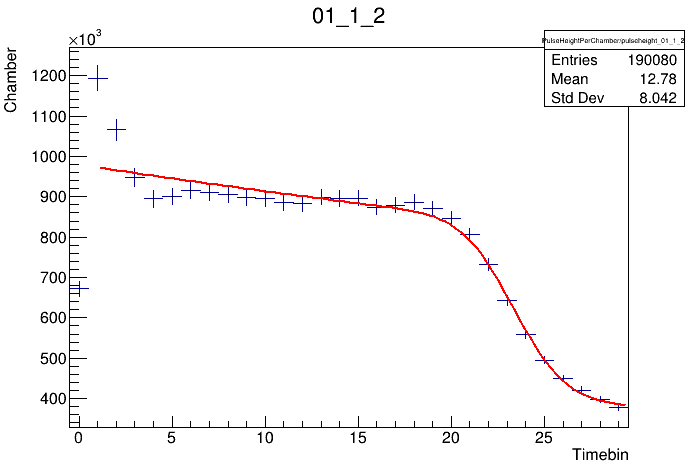
I tried to fit this histogram with double exponential + constant function. We also tried several other functions. But I am not able to do a combine fit of this histogram. I have also attached the code.
Can you please suggest me how can I fit this histogram?
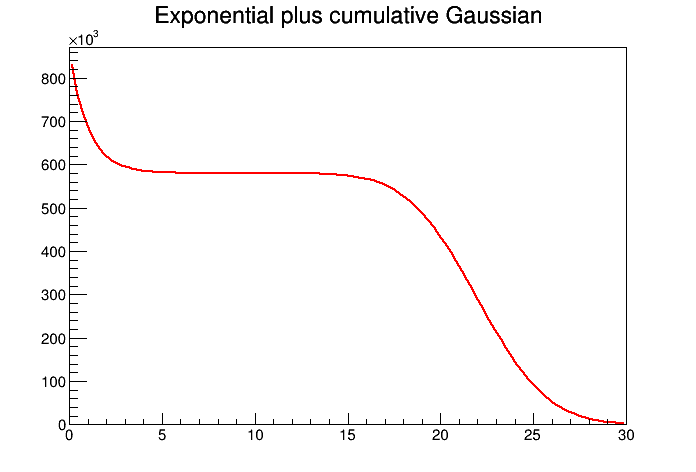
what you have looks definitely like a Fermi function/sigmoid/cumulative Gaussian (all equivalent anyway), plus maybe a single exponential at the beginning (or even another sigmoid on top).
Here is how you could define a sigmoid plus exponential function:
// testFunc.C

double myfunc(double *x, double *p) {

    double u = p[0]; // uniform plateau hight
    double c = p[1]; // coefficient for exponential
    double tau = p[2]; // exponential parameter
    double mu = p[3]; // Gaussian position
    double sigma = p[4]; // Gaussian width

    using ROOT::Math::gaussian_cdf;
    return u * ((1-gaussian_cdf(x[0], sigma, mu)) + c * std::exp(-tau * x[0]));

}

void func() {

  auto *f1 = new TF1("f1", myfunc, 0, 30.0, 5);
  f1->SetTitle("Exponential plus cumulative Gaussian");
  f1->SetParameters(580000.0, 0.5, 1.0, 22.0, 3.0);
  f1->Draw();
  gPad->SaveAs("plot.png");
}
I have tried this function and it is coming like this. I am not able to fit all the points.
What I want from this fitting is to extract some parameters such as slope of the constant region from 8 to 20.
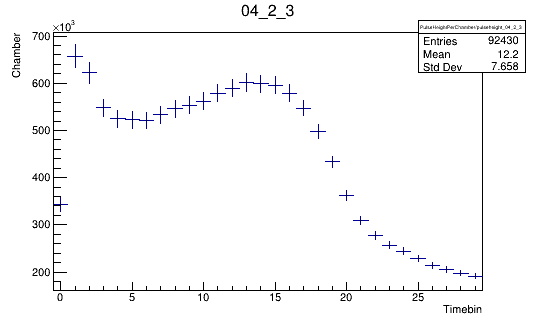
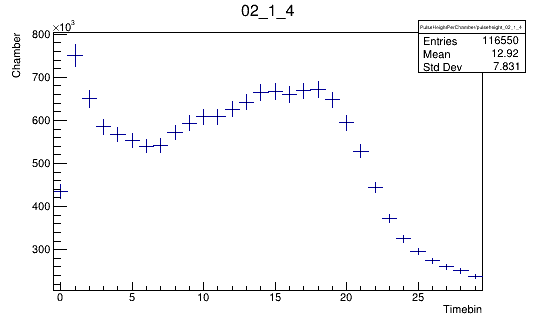
I can somehow tweak the parameters so that fit looks good but the problem is that I have to do this for more than 500 histograms. Thus, I am looking for a general functions that will able to fit all the histograms which do not differ much. I am attaching some histos for reference.
Thanks
It seems a simple “Exponential plus cumulative Gaussian” function is insufficient for describing your experimental data.
You need to talk to your colleagues and / or your supervisor about how to “model” them.