Fitting histogram with weights: very large parameter errors

Hello,

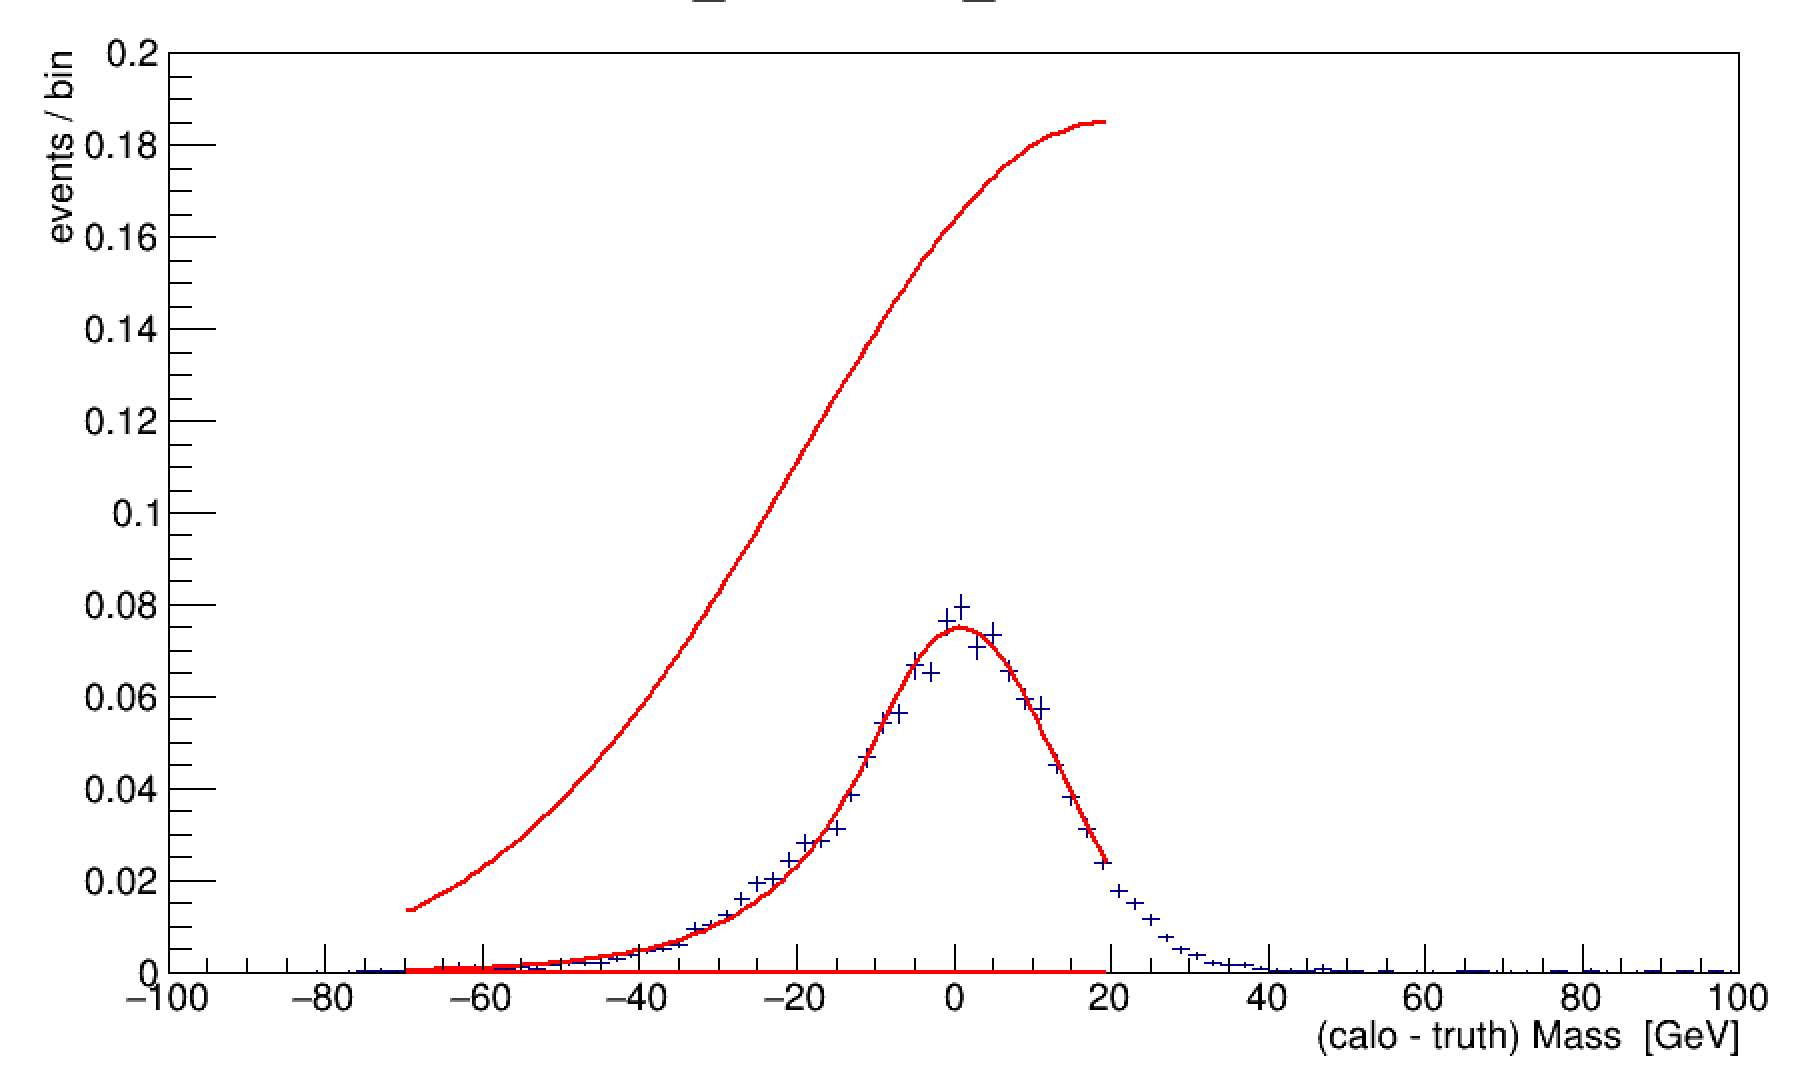
I am trying to fit a set of TH1’s with an user defined function. While the fitted parameters values converge and look very good at first sight, the parameter errors are unnaturally large, as much as 10^2 times the parameter value. I attach with one of such fitted histograms, together with the fitted function plotted with the fit parameters shifter up and down by 1sigma.

Each TH1 is filled as it follows:

[code]
calMtruth_histos.push_back(new TH1F(“h_calM-truth_mass”+mass_name,“h_calM-truth_mass”+mass_name+";(calo - truth) Mass [GeV];events / bin",100,-100,100));
calMtruth_histos.at(i_file)->Sumw2();
calMtruth_histos.at(i_file)->Fill(FatJet_M-V_mass_t,evtWeight*luminosity);

[/code]

The fitting function is a user-defined crystalBall:

 double CrystalBall(double* x, double* par){ //http://en.wikipedia.org/wiki/Crystal_Ball_function                                                                                 
  double xcur = x[0];
  double alpha = par[0];
  double n = par[1];
  double mu = par[2];
  double sigma = par[3];
  double N = par[4];
  TF1* exp = new TF1("exp","exp(x)",1e-20,1e20); double A; double B;
  if (alpha < 0){
    A = pow((n/(-1*alpha)),n)*exp->Eval((-1)*alpha*alpha/2);
    B = n/(-1*alpha) + alpha;
  }
  else {
    A = pow((n/alpha),n)*exp->Eval((-1)*alpha*alpha/2);
    B = n/alpha - alpha;
  }
  double f;
  if ((xcur-mu)/sigma > (-1)*alpha)
    f = N*exp->Eval((-1)*(xcur-mu)*(xcur-mu)/ (2*sigma*sigma));
  else
    f = N*A*pow((B- (xcur-mu)/sigma),(-1*n));
  delete exp;
  return f;
}

The fit is performed with in the following way:

TF1* cball_cal = new TF1("cball2",CrystalBall,-80,80,5);
    cball_cal->SetParameter(0,1);
    cball_cal->SetParameter(2,calMtruth_histos.at(i_file)->GetMean());
    cball_cal->SetParameter(3,calMtruth_histos.at(i_file)->GetRMS()/2);
    cball_cal->SetParameter(4,calMtruth_histos.at(i_file)->Integral()/(calMtruth_histos.at(i_file)->GetRMS()*TMath::Sqrt(2*3.141592)));

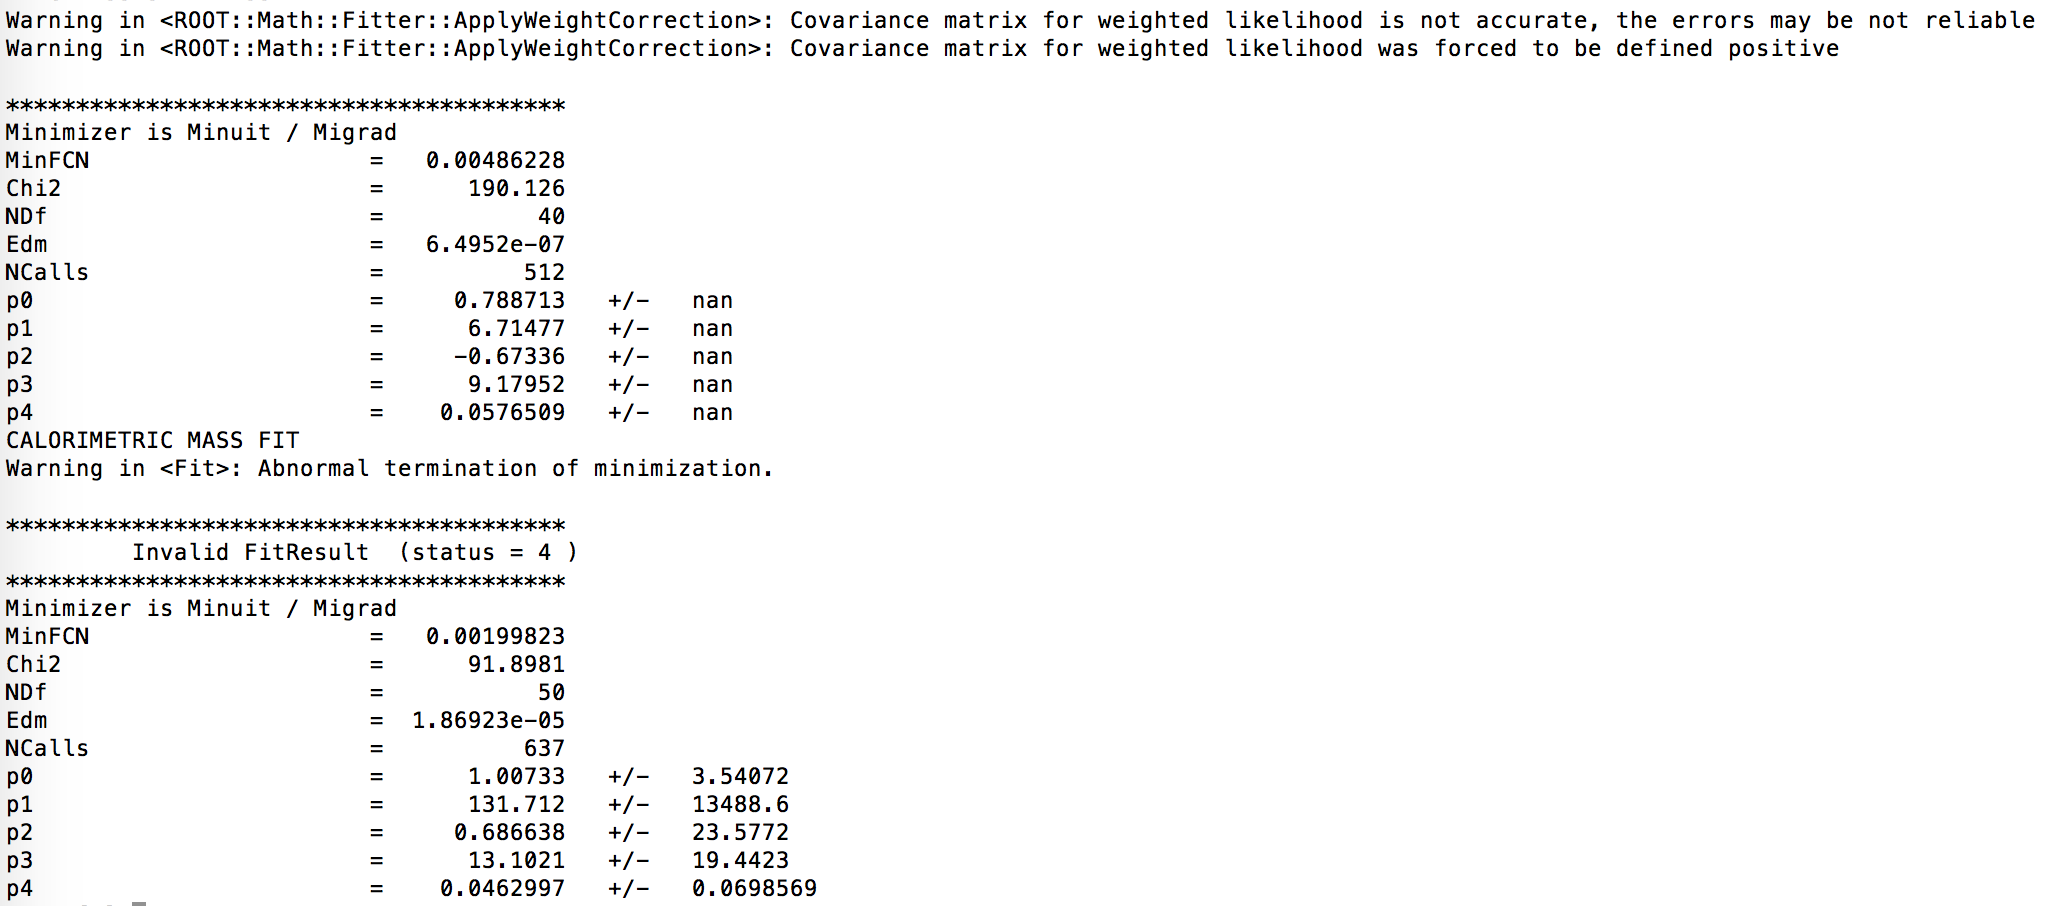
    cout << "CALORIMETRIC MASS FIT" << endl;

    TFitResultPtr fitCal = calMtruth_histos.at(i_file)->Fit("cball2","P","",-70,20);
    TF1* fitC = calMtruth_histos.at(i_file)->GetFunction("cball2");

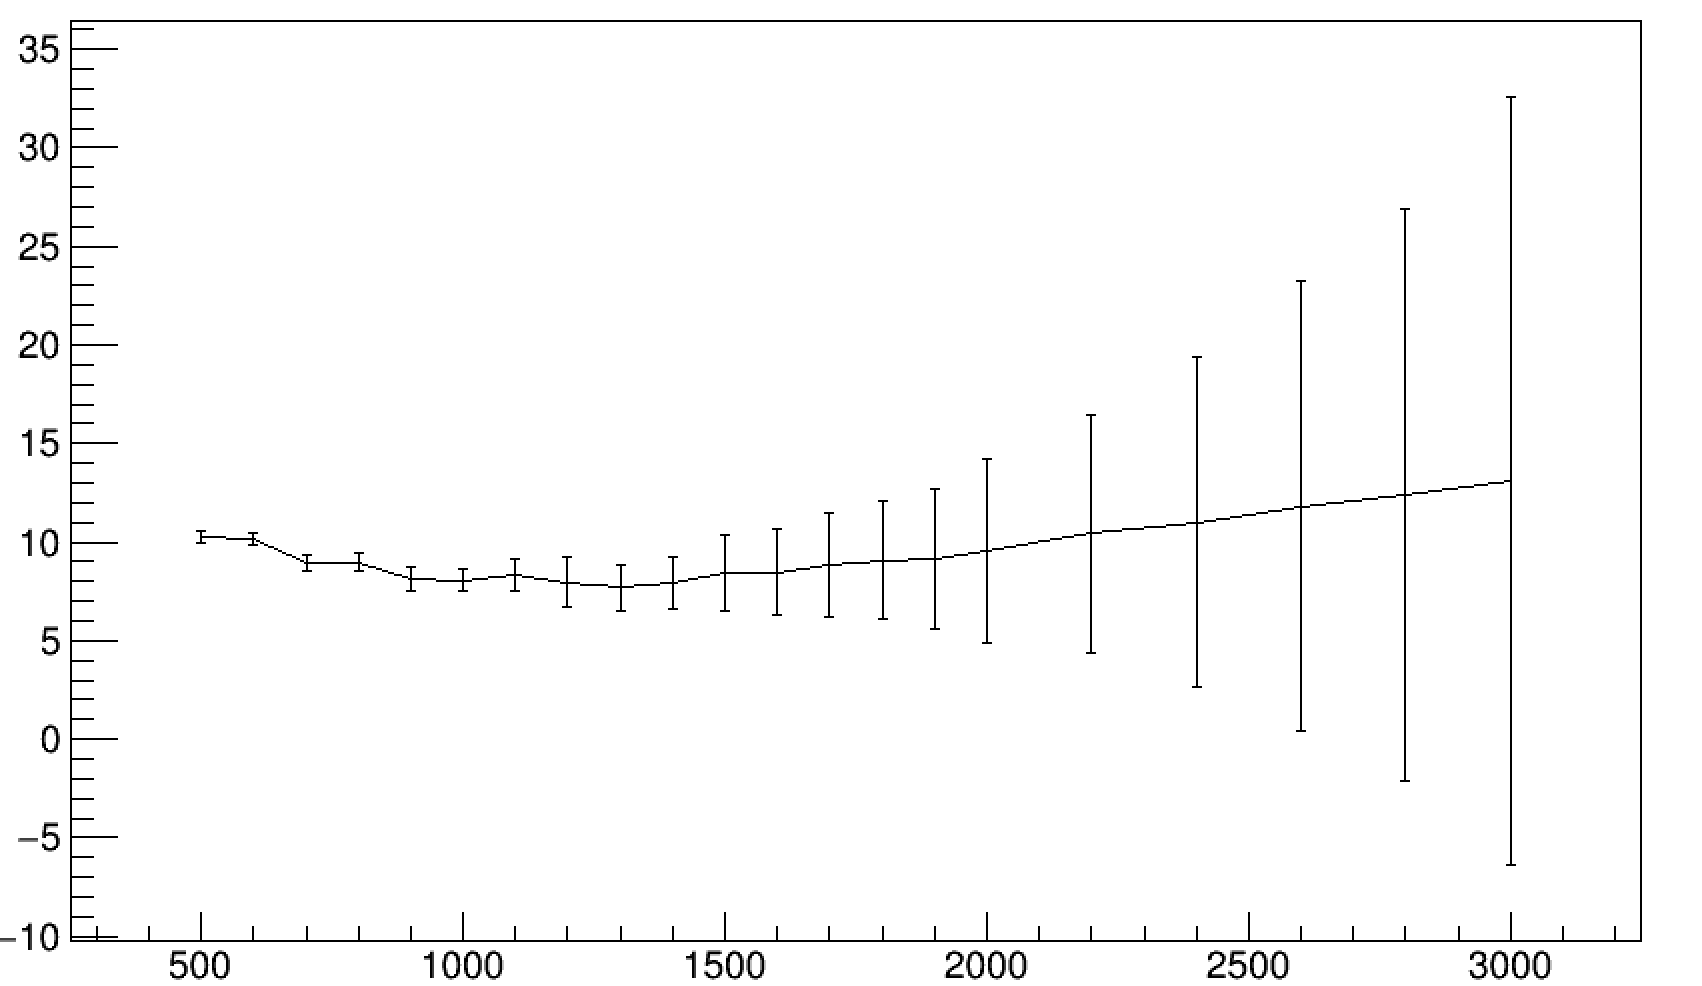
I’m doing this as a part of a resolution study on a number of signal samples of increasing mass. Each TH1 pertains to a sample with a certain mass and cross section. The number of actual unweighted events is generally consistent between samples. The cross section however, decreases (and thus so do the event weights) as the sample mass increases.
I noticed that the error on the fitted parameters increases in a roughly linear pattern with the sample mass. I attached an example of the fit output for the last few histograms and an example of the way the parameter errors increase at high sample mass.

Thank you for your help!


Hi,

I don’t think you can use option “P” with a weighted histograms. With option P the weight in each bin is computed using the expected function value, but there is no correction for the weight.
I would use the “LW” option which is anyway always more accurate when fitting histograms.

Best,

Lorenzo

  1. If you get an “Abnormal termination of minimization” (and/or “STTAUS=FAILED”) then the returned errors are meaningless.
  2. I don’t know what the “P” fit option is supposed to do.
  3. Try with “E” and/or “ME” fit options.

Hi,

Please do not provide links to old documentation page.
The option “P” is documented in the updated reference guide, see

root.cern.ch/doc/master/classTH … 3ca47dabdd

And it refers to use as weights in the least square the expected errors obtained from the function values instead of the histogram bin errors

Lorenzo

Hi,

Actually option “P” can be used to fit weighted histograms if you have called TH1::Sumw2() to support storing weights in the histogram.

Lorenzo

You forgot to say which “minimal” ROOT version is required (i.e. supports “P”).

Hi,
Thank you all for the suggestions and fast replies. I already tried different options but the result does not change significantly. The plots I attached were actually made using the “L” option, I just erroneously quoted an edited version of the code. The P option fails to come up with a result altogether, without even yielding error values (-nan as parameter error in every case). I also tried the E and ME options, but the only visible result was the program being slowed down considerably, as expected.

@lorenzo[quote]Actually option “P” can be used to fit weighted histograms if you have called TH1::Sumw2() to support storing weights in the histogram.[/quote] I have indeed set sumw2() for all histograms, but P still fails to produce anything.

@pepe: were you addressing lorenzo’s post or you meant to ask wich version of ROOT I am using?

I think that, for “weighted histograms”, you need to use “WL” (not just “L”).

In principle, if you really want to use “P”, someone explicitly needs to say which “minimal” ROOT version is required and you should make sure that your ROOT is “newer” (otherwise “P” will have no effect at all, but you will not get any warning).

The minimal ROOT version for option “P” is ROOT version 6

Lorenzo

[quote=“Pepe Le Pew”]I think that, for “weighted histograms”, you need to use “WL” (not just “L”).
[/quote]
I tried WL already, but again no improvement whatsoever. Here’s the output of the last few fits performed with the WL option.


Hi,

What is the number of effective entries in your histogram as function of the mass ? This is what counts for defining the parameter errors not the actual number of unweighted entries

Lorenzo

[quote=“moneta”]Hi,

What is the number of effective entries in your histogram as function of the mass ? This is what counts for defining the parameter errors not the actual number of unweighted entries

Lorenzo[/quote]

Accounting for cross section, scale factors and luminosity:

Sample Mass | nEvents 0500 | 10374 0600 | 9958 0700 | 6983 0800 | 4334 0900 | 2487 1000 | 1993 1100 | 1370 1200 | 998 1300 | 669 1400 | 520 1500 | 373 1600 | 279 1700 | 202 1800 | 158 1900 | 118 2000 | 93 2200 | 54 2400 | 34 2600 | 21 2800 | 13 3000 | 9

The actual unweighted entries are around 15k-25k for each sample.

Hi,

If your number of effective entries decreases so much, then it is perfectly normal that the statistical errors on your fit parameter increases

Lorenzo

So if I scaled the histograms to a much higher luminosity I should expect the errors to decrease accordingly?
Shouldn’t the errors depend on how the points are placed rather than by the scale?

Anyway, I did try setting an unreasonably large common scale factor, and while the errors indeed became smaller, some fits still fail (even though the displayed fitted curve is yet again perfect).