Fitting histogram using mean values of bins

Hi ,
The fitting method uses the function evaluated at the center of the bin for fitting. Instead I want to use the mean value of the entries in the bin. I think maybe what I’m looking for is the option " I " of TH1::Fit Method , however I don’t understand well this option. Any help ?

Thanks !


_ROOT Version:5.34/36
Platform, compiler gcc version 4.9.3 (GCC)

One needs to use the “I” fit option if the function changes significantly inside of histogram bins.

{
  gStyle->SetOptFit();
#if 0 /* 0 or 1 */
  TF1 *f = ((TF1*)(gROOT->GetFunction("gaus")));
  if (f) f->SetParameters(1., -0.5, 1.5); // "Constant", "Mean", "Sigma"
#endif /* 0 or 1 */
  TH1F *h1 = new TH1F("h1", "h1", 100, -4., 6.); h1->Sumw2(kTRUE);
  h1->FillRandom("gaus", 10000);
  TH1F *h1i = new TH1F(*h1); h1i->SetNameTitle("h1i", "h1i");
  TH1F *h2 = new TH1F(*h1); h2->SetNameTitle("h2", "h2");
  h2->Rebin(25); // "h2 Constant" = 25 * "h1 Constant", no "Sigma" change
  TH1F *h2i = new TH1F(*h2); h2i->SetNameTitle("h2i", "h2i");
  TCanvas *c = new TCanvas("c", "c");
  c->Divide(2, 2);
  c->cd(1); h1->Fit("gaus");
  c->cd(3); h1i->Fit("gaus", "I");
  c->cd(2); h2->Fit("gaus"); // see the fitted "Constant" and "Sigma"
  c->cd(4); h2i->Fit("gaus", "I");
  c->cd(0);
}
1 Like

These are the plots I produced with your code:

  • first row : no “I” option used
  • second row: option “I” used
  • first column: 100 bins histograms
  • second column: 4 bins histograms

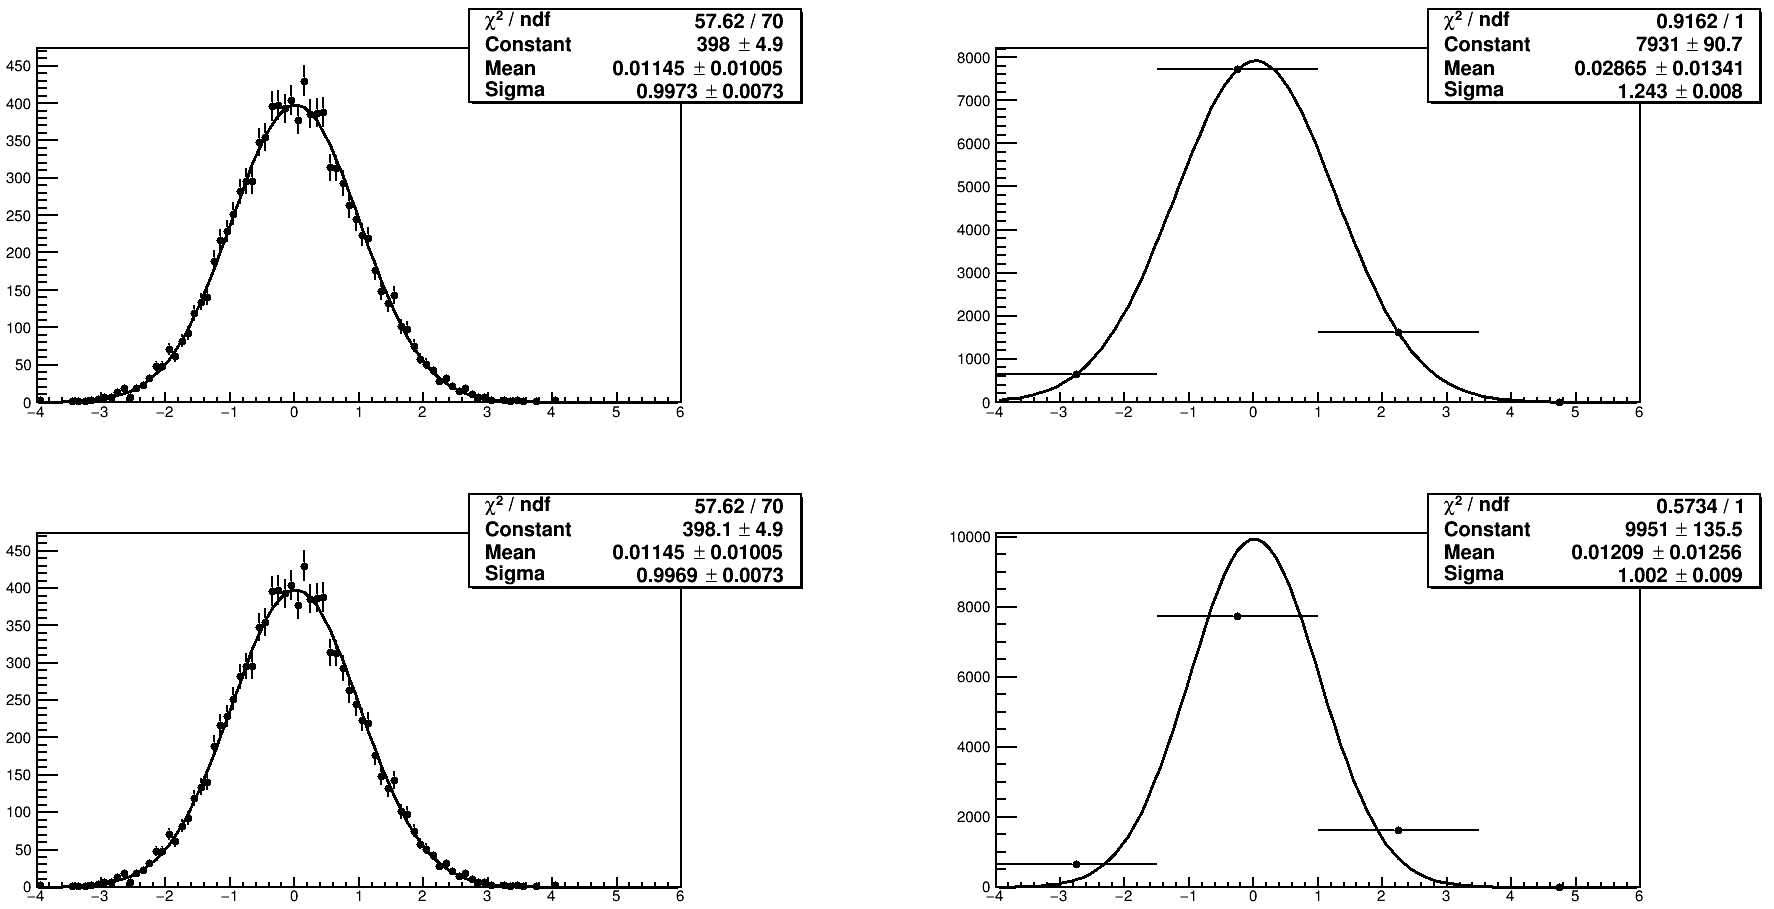
The mean and sigma are much better when the ‘I’ option is used, that is better seen in the second row of plots. So the ‘I’ option is using the integral of function in bin (I suppose the area of the function in that bin), however the problem I have is different (I think so).
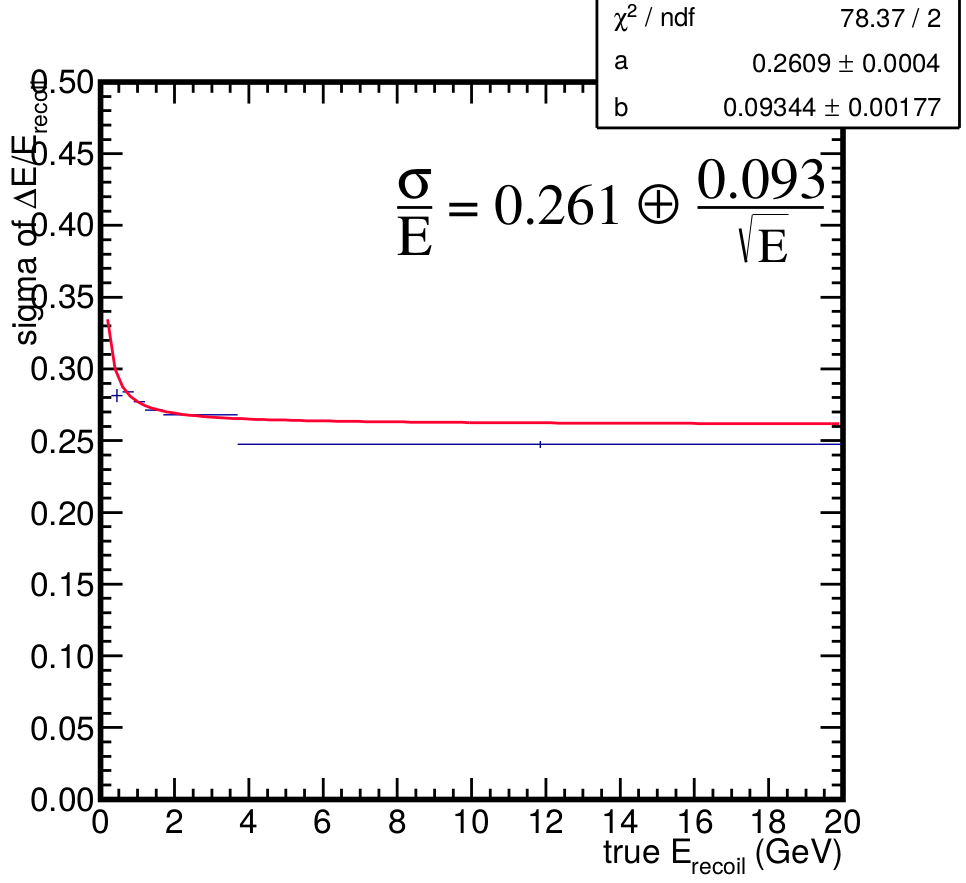
I have bins of data , one of those bins is huge. When I fit the data to a specific user defined function I want to take in account that most of the events in that huge bin are in the lower half of the bin. That’s why I thought on using the mean of values in the bin (mean of x axis values) instead of the bin center. This is my fitted function and the data bins.

Try to remove the very first point from your fit (it seems that your function is not able to describe it).

This topic was automatically closed 14 days after the last reply. New replies are no longer allowed.