Hi experts.
I have a problem when i fitting the histogram with two gausian function.
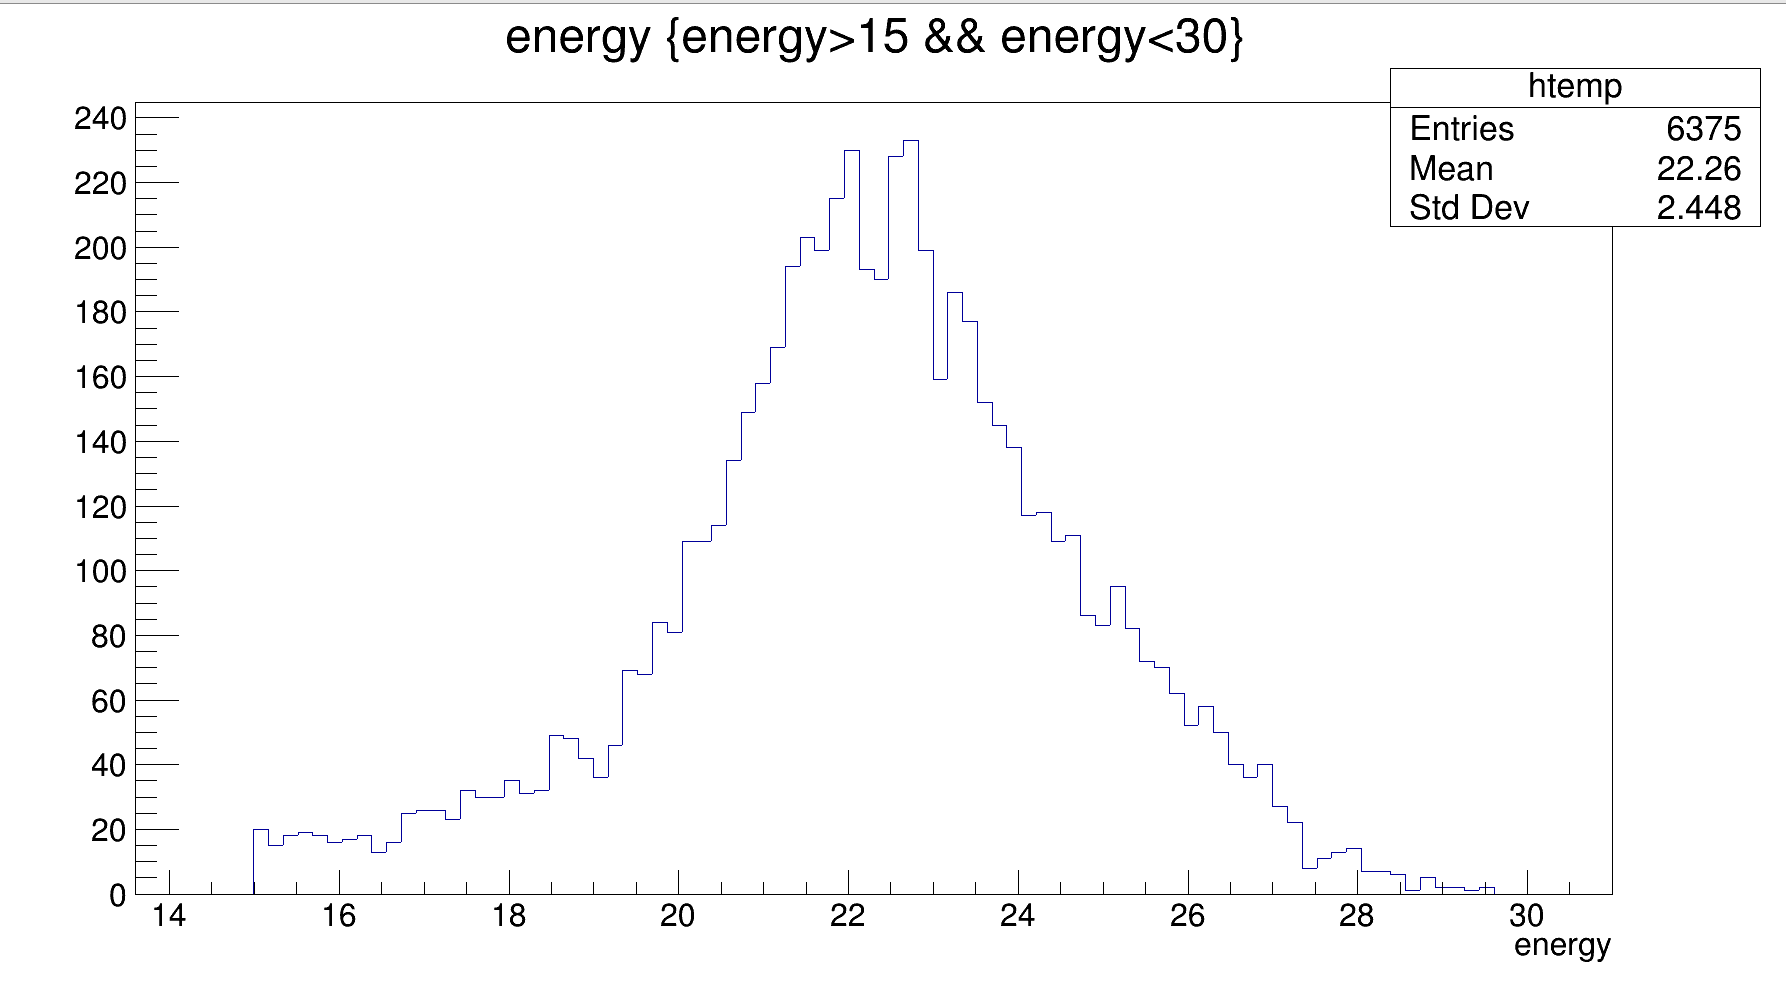
First pic is the Cd low energy spectrum and i wanna fitting this histogram with two gausian function (according to Cd109 xray table it must be show the peak at around 22keV(Relative probability 153) and 25keV(27.7).
And these are what i used the code and result.
double sgaus (double * v, double * p);
double sgausC(double * v, double * p);
double dgaus (double * v, double * p);

void Cd109()
{
  TChain * chain = new TChain("t3");
  chain->Add("data/tree.root");

  TCanvas * can = new TCanvas("can", "", 1600, 600);
  can->Divide(2,1);
  can->cd(1);

  TH1F * hE = new TH1F("hE", "", 100, 10, 30);
  chain->Draw("energy>>hE");
  hE->Sumw2();

  TF1 * fit1 = new TF1("fit1", sgausC, 19, 30, 4);
  fit1->SetParameters(220, 22, 2, 10);
  fit1->SetLineColor(2);
  fit1->SetLineWidth(4);
  hE->Fit(fit1, "+r");

  TF1 * fit2 = new TF1("fit2", sgausC, 19, 30, 4);
  fit2->SetParameters(39.8, 26, 2, 10);
  fit2->SetLineColor(4);
  hE->Fit(fit2, "+r");

  TF1 * fit3 = new TF1("fit3", dgaus,  19, 30, 4);
  fit3->SetParameters(222, 23, 3, 10);
  fit3->SetLineColor(3);
  hE->Fit(fit3,"+r");


  TF1 * plot = new TF1("plot", dgaus, 19, 30, 7);
  for(int i = 0; i < 7; i++)
    plot->SetParameter(i, fit1->GetParameter(i));
  plot->SetLineColor(3);
  plot->Draw("same");

  can->cd(2);
  TH1F * hEsub = new TH1F("hEsub", "", 100, 19, 30);
  for(int i = 0; i < 100; i++){
    double cent = hE->GetBinCenter (i+1);
    double cont = hE->GetBinContent(i+1);

    double model = plot->Eval(cent);

    if(cont != 0)
      hEsub->SetBinContent(i+1, (cont - model)/TMath::Sqrt(cont));
  }

  hEsub->SetDirectory(0);
}

double sgaus(double * v, double * p)
{
  return TMath::Abs(p[0])*TMath::Gaus(v[0], p[1], p[2]);
}

double sgausC(double * v, double * p)
{
  return sgaus(v, p) + TMath::Abs(p[6]);
}

double dgaus(double * v, double * p)
{
  return sgaus(v, &p[0]) + sgaus(v, &p[3]) + TMath::Abs(p[6]);
}
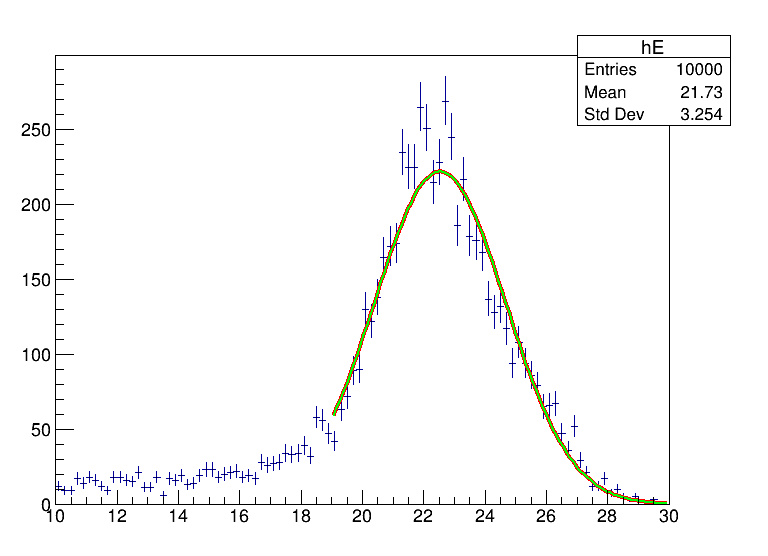
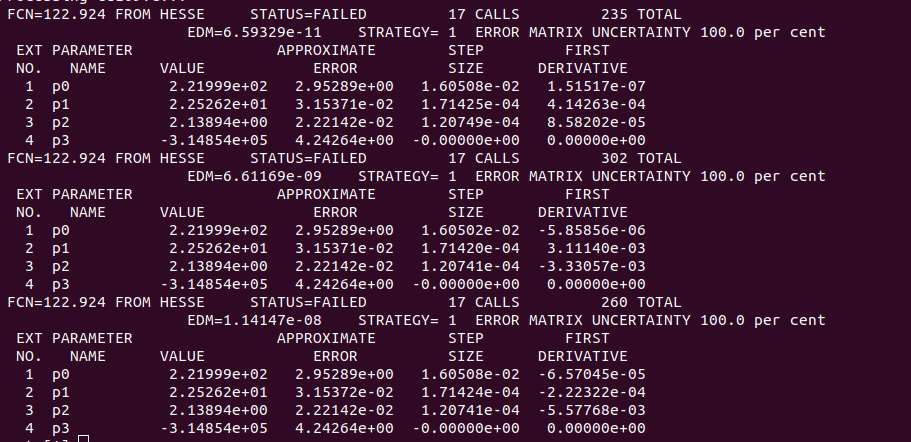
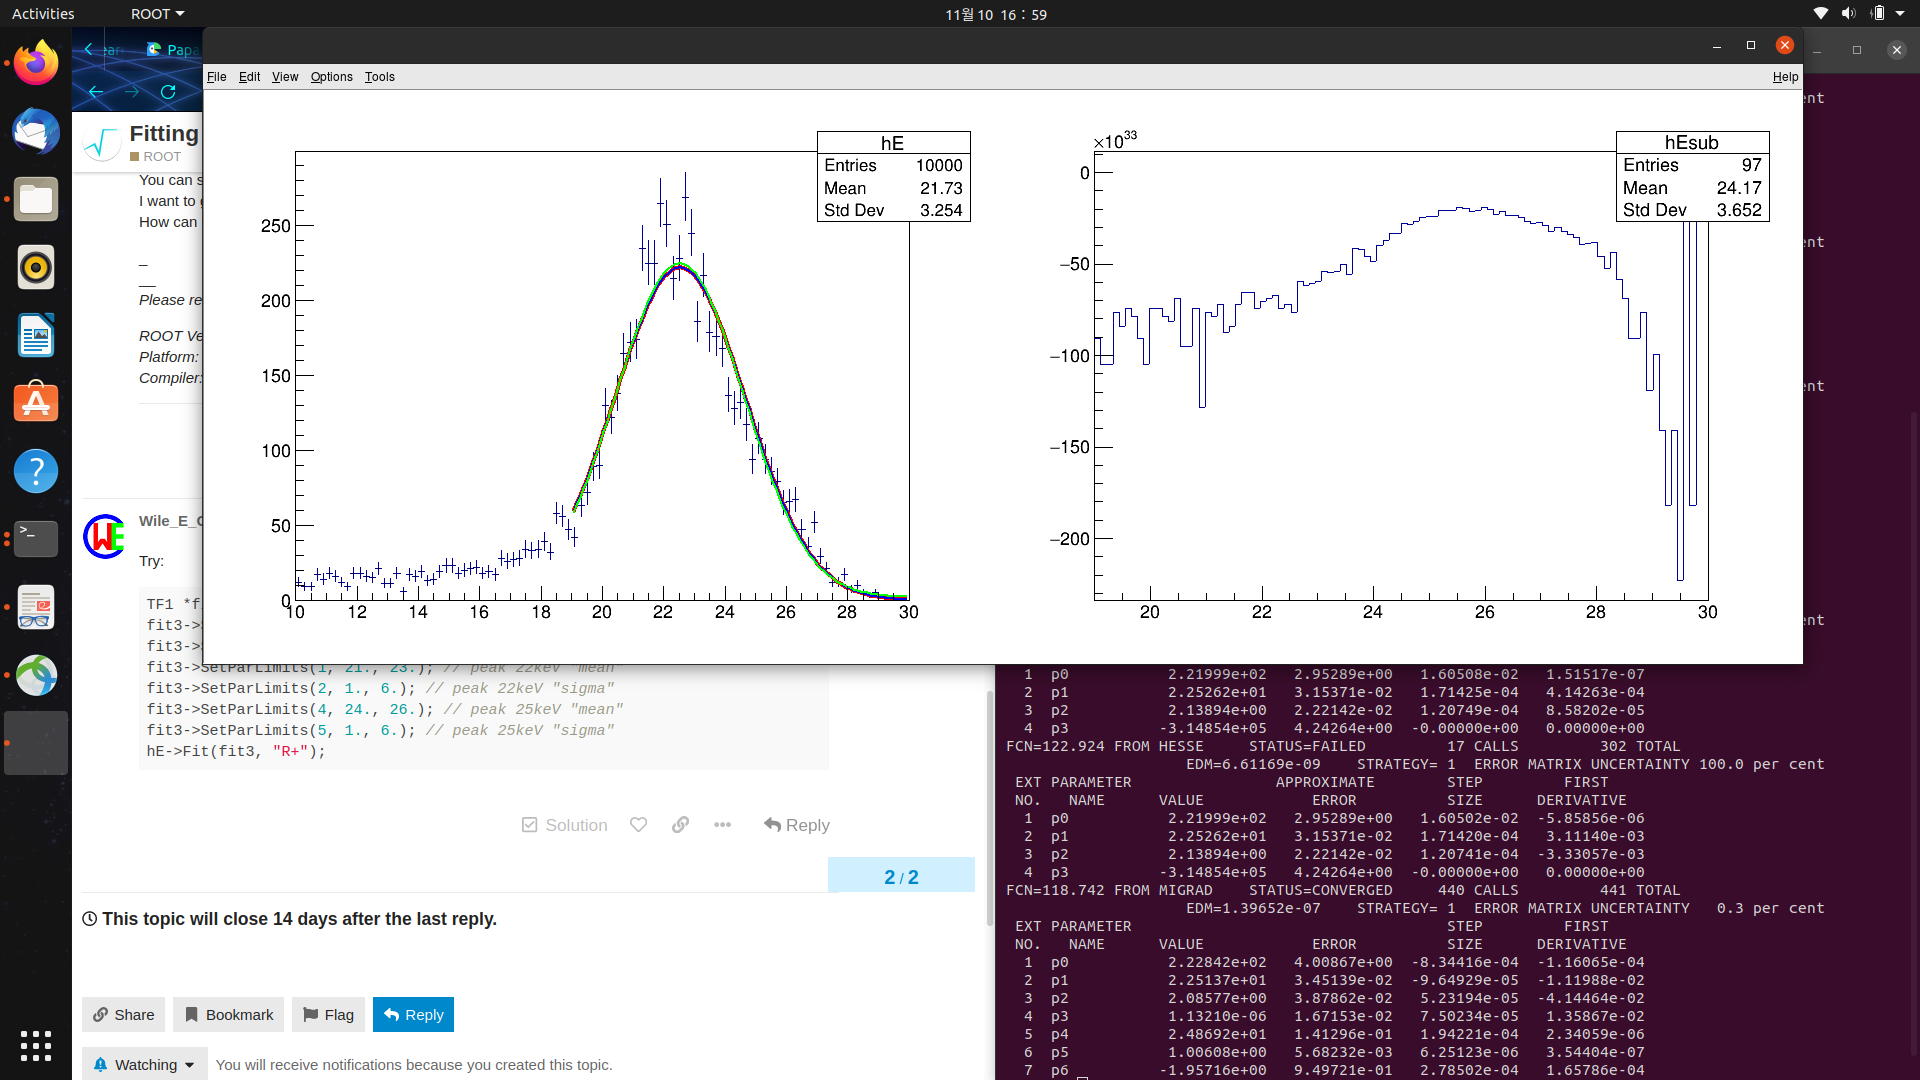
You can see the above pic, the three fitting results are the same.
I want to get three different fitting result.
How can i solve this problem?
_
__
Please read tips for efficient and successful posting and posting code
ROOT Version: Not Provided
Platform: Not Provided
Compiler: Not Provided