Hello, for educational reason, I want to show the experiment to measure the Plank constant to students using LED and Arduino.
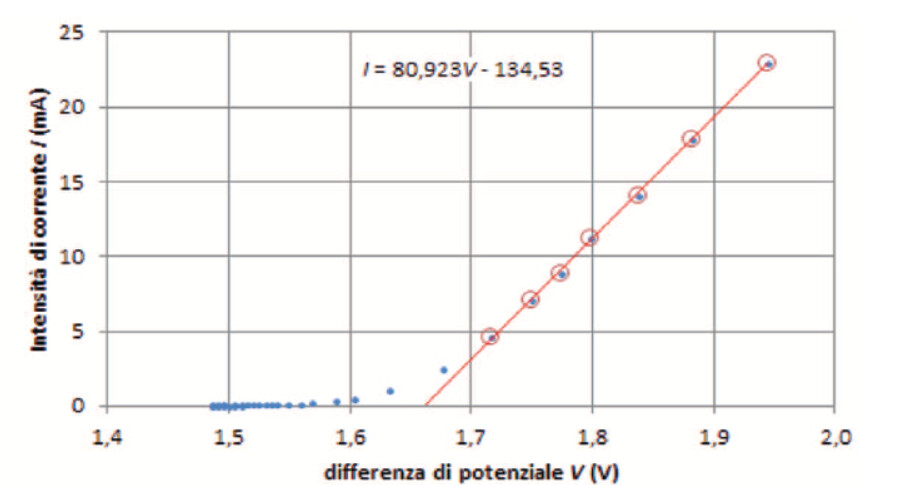
I must get a plot like this one
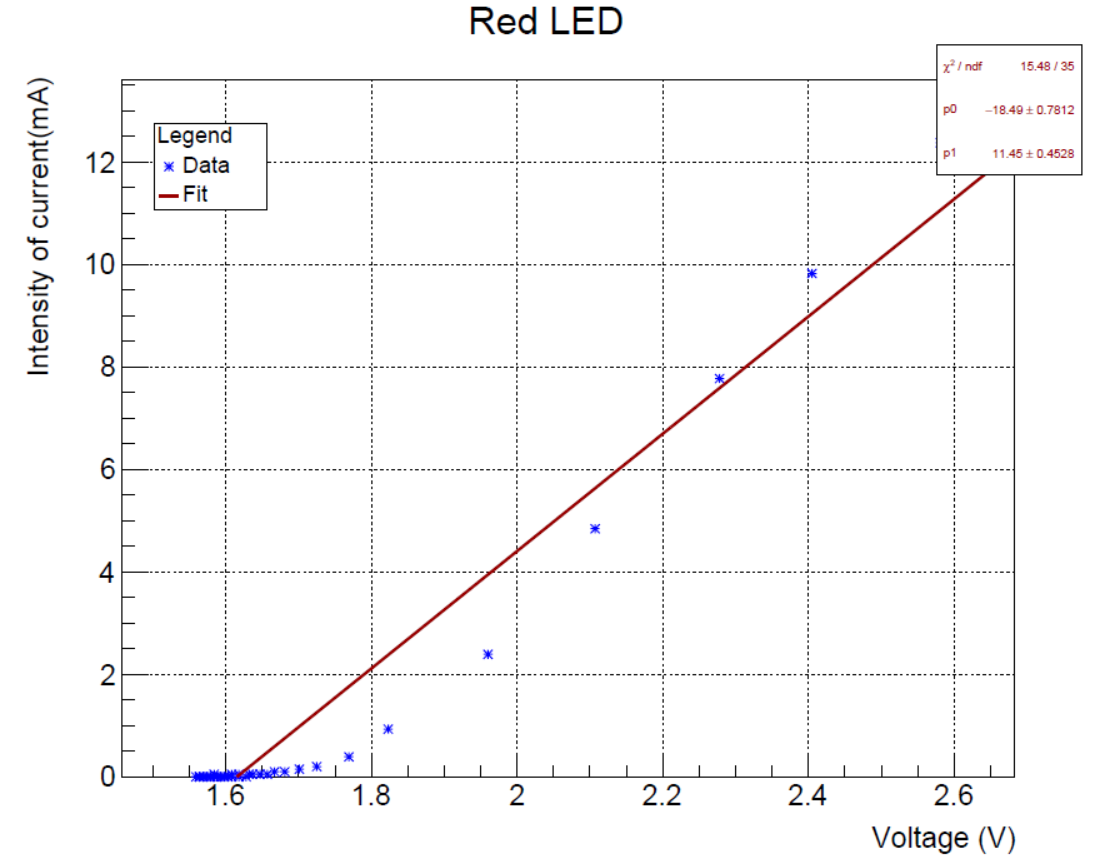
so I’ve to fit just a range of the plot , i.e. Voltage > 1.8V and I wrote
TF1 *fitgraph = new TF1(“fitgraph”, “pol1”, 1.85,3.);
but When I plot, I get the fit of all data…
data_red.txt (384 Bytes) plank.cpp (1.9 KB)
Please read tips for efficient and successful posting and posting code
ROOT Version: Not Provided
Platform: Not Provided
Compiler: Not Provided