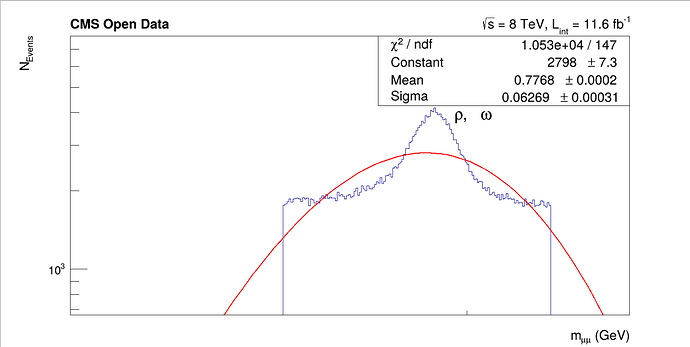
Hello. I’ve been trying to perform di-muon analysis using CMS open data taken from here. I’m trying to isolate the resonance peaks of the invariant mass and fit them to find their mean, and to compare this with the given pdg values. Here is my code:
#include "ROOT/RDataFrame.hxx"
#include "ROOT/RVec.hxx"
#include "Math/Vector4Dfwd.h"
#include "Math/Vector4D.h"
#include "TCanvas.h"
#include "TH1D.h"
#include "TLatex.h"
#include "TStyle.h"


using namespace ROOT::VecOps;

// Compute the invariant mass of two muon four-vectors
float computeInvariantMass(RVec<float>& pt, RVec<float>& eta, RVec<float>& phi, RVec<float>& mass) {
    ROOT::Math::PtEtaPhiMVector m1(pt[0], eta[0], phi[0], mass[0]);
    ROOT::Math::PtEtaPhiMVector m2(pt[1], eta[1], phi[1], mass[1]);
    return (m1 + m2).mass();
}


void dimuonSpectrum_pg() {
    // Enable multi-threading
    // The default here is set to a single thread. You can choose the number of threads based on your system.
    ROOT::EnableImplicitMT(8);

    // Create dataframe from NanoAOD files
    ROOT::RDataFrame df("Events", "Run2012BC_DoubleMuParked_Muons.root");

    // Select events with exactly two muons
    auto df_2mu = df.Filter("nMuon == 2", "Events with exactly two muons");

    // Select events with two muons of opposite charge
    auto df_os = df_2mu.Filter("Muon_charge[0] != Muon_charge[1]", "Muons with opposite charge");

    // Compute invariant mass of the dimuon system
    auto df_mass = df_os.Define("Dimuon_mass", computeInvariantMass,
                                {"Muon_pt", "Muon_eta", "Muon_phi", "Muon_mass"});

    // Select events that result in inavriant mass of eta
    auto df_ro = df_mass.Filter("Dimuon_mass > 0.7 && Dimuon_mass < 0.85", "Eta");


    // Create canvas for plotting
    gStyle->SetOptStat(0);
    gStyle->SetOptFit(1);
    gStyle->SetTextFont(42);
    auto c = new TCanvas("c", "", 800, 700);
    c->SetLogx();
    c->SetLogy();

    // Book histogram of dimuon mass spectrum
    const auto bins = 300; // Number of bins in the histogram
    const auto low = 0.6; // Lower edge of the histogram
    const auto up = 0.9; // Upper edge of the histogram
    auto hist = df_eta.Histo1D({"", "", bins, low, up}, "Dimuon_mass");

    // Draw histogram
    hist->GetXaxis()->SetTitle("m_{#mu#mu} (GeV)");
    hist->GetXaxis()->SetTitleSize(0.04);
    hist->GetYaxis()->SetTitle("N_{Events}");
    hist->GetYaxis()->SetTitleSize(0.04);
    hist->Fit("gaus");
    hist->DrawClone();

    // Draw labels
    TLatex label;
    label.SetTextAlign(22);
    label.DrawLatex(0.7, 7.0e3, "#rho, #omega");
    label.SetNDC(true);
    label.SetTextAlign(11);
    label.SetTextSize(0.04);
    label.DrawLatex(0.10, 0.92, "#bf{CMS Open Data}");
    label.SetTextAlign(31);
    label.DrawLatex(0.90, 0.92, "#sqrt{s} = 8 TeV, L_{int} = 11.6 fb^{-1}");

    // Save plot
    c->SaveAs("eta.png");

    // Request cut-flow report
    auto report = df_ro.Report();

    // Print cut-flow report
    report->Print();
}


int main() {
    dimuonSpectrum_pg();
}
My output looks like:
As you can see, my fit refuses to become a gaussian, even though the data very clearly looks like one. Any advice would be very appreciated.
Please read tips for efficient and successful posting and posting code
