Hello Experts,
I wanted to know how should I fill in a 1D histogram for nhits after an interval of 1.2e9 secs. I am attaching the block of code for your ref along with the terminal result, What I am trying to do now is to get nhit distributions in each of these time intervals.
for (Long64_t iHit=0; iHit<nHits;iHit++)
{ //##
if (RecoHitPos[iHit][0] != -999) {
double boundary = RecoHitPos[iHit][3];
double t = 0.0;
while (t < boundary || t == boundary)
{
t += 1.2e9;
}
t_entry_count_map[t]++;
total_entry_count++;
}
}//##
}
std::cout << "Number of entries corresponding to each t value:" << std::endl;
for (const auto& entry : t_entry_count_map)
{
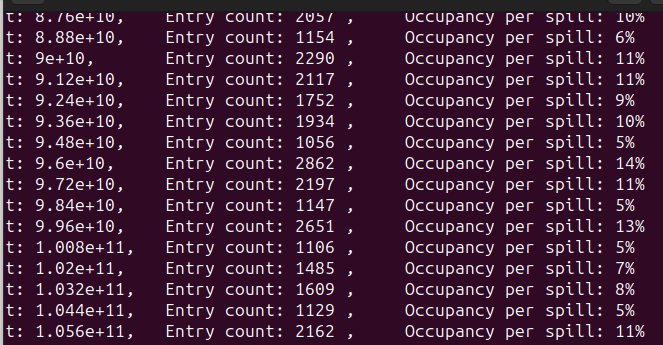
cout << "t: " << entry.first << ", Entry count: " << entry.second <<" , Occupancy per spill: "<<entry.second*100/19200<<"%"<< endl;
}
}
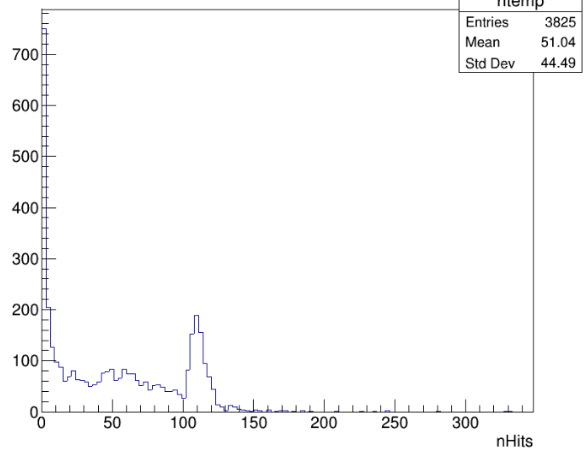
 also attaching how the distribution looks like as a whole
Kindly let me know hoe get the distribution.
Best,
R