Hi all,
I was trying to visualise the mesh generated from Silvaco, stored in a str file. I have also tried with the Sentaurus provided in the example TCAD. In both cases, I am unable to get a render in the root TCanvas. I get a blank TCanvas with nothing in it. I get axes after including meshview->EnableAxes() (pic attached). Both the pics are from the code, using str file.
Q1. Is it possible to view a mesh from the synopsis or str file?
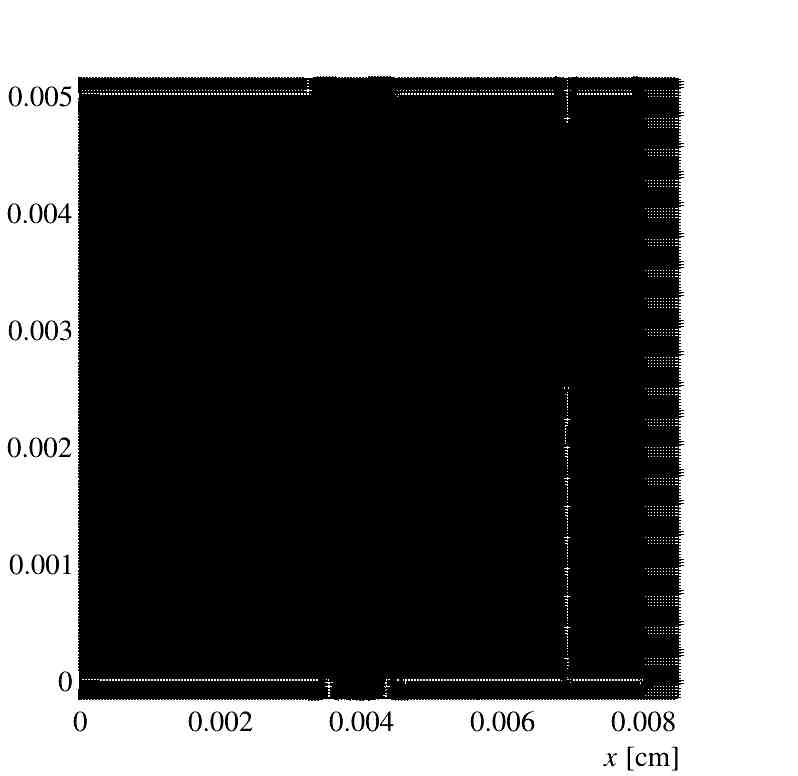
Q2. I was also trying to plot field inside using the ViewField. I get dense black lines inside the TCanvas without any colour coding (also attached as pic).
#include <iostream>
#include <TApplication.h>
#include <TCanvas.h>
#include <Garfield/ComponentTcad2d.hh>
#include <Garfield/ViewFEMesh.hh>
#include <Garfield/MediumSilicon.hh>
#include <Garfield/MediumConductor.hh>
#include <Garfield/MediumPlastic.hh>
#include <Garfield/Sensor.hh>
#include <Garfield/ViewField.hh>

using namespace Garfield;

int main(int argc, char* argv[]) {

    TApplication app("app", &argc, argv);

    ComponentTcad2d *tcad = new ComponentTcad2d;

    tcad->InitialiseSilvaco(
        "../../Simulation_Mats/EF_LGAD_Np4.269e16_Dp2.2um_Nb4.5e12_Dn0.8_Nn6e18_48umDD_293K_100V.str"
    );

	tcad->PrintRegions();
	MediumSilicon silicon;
	silicon.SetTemperature(293.);

	MediumConductor* al = new MediumConductor();

	MediumPlastic* sio2= new MediumPlastic();
	sio2->SetDielectricConstant(3.9);
	tcad->SetMedium("6",sio2);
	tcad->SetMedium("3",al);
	tcad->SetMedium("1", &silicon);
    tcad->PrintRegions();

    double xmin, ymin, zmin;
	double xmax, ymax, zmax;

	tcad->GetBoundingBox(xmin, ymin, zmin,xmax, ymax, zmax);

	std::cout << "X range: " << xmin << " to " << xmax << std::endl;
	std::cout << "Y range: " << ymin << " to " << ymax << std::endl;
	std::cout << "Z range: " << zmin << " to " << zmax << std::endl;

	 // Create canvas
	TCanvas* cf = new TCanvas("cf", "Silvaco Mesh", 800, 800);

	Sensor *sensor = new Sensor();
	sensor->AddComponent(tcad);

	ViewField *FieldView = new ViewField();
	FieldView->SetComponent(tcad);

	FieldView->SetCanvas(cf);
	FieldView->SetArea(0.0, -0.00015, 0.0085, 0.00515);
	FieldView->Plot("v");


	TCanvas* cf2 = new TCanvas("cf2", "Silvaco Mesh", 800, 800);

	ViewFEMesh *meshView = new ViewFEMesh();
	meshView->SetComponent(tcad);
	meshView->SetCanvas(cf2);
	meshView->SetArea(xmin, ymin, xmax, ymax);
	meshView->SetFillMesh(true);
	meshView->SetColor(1,kYellow-7);
	meshView->SetColor(3,kGray);
	meshView->SetColor(6,kBlue);
	meshView->EnableAxes();
	meshView->Plot();

    app.Run();

    return 0;
}