Hi,
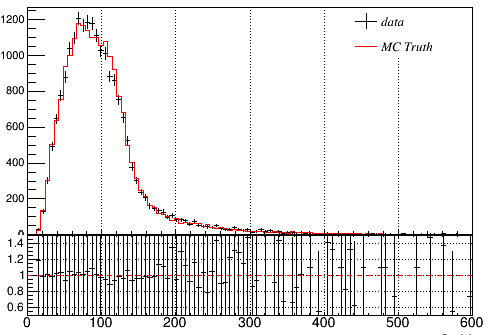
Could someone please help me understand why the vertical bars in data/MC ratio at the bottom plot is coming large than required?
 // mc is the MC histogram as shown in the upper pad while data is the histogram shown in the upper pad.
 // Following lines I write in bottom pad:
 mc->Scale((data->Integral())/(mc->Integral()));//To normalise MC to data
 data->Divide(mc);
 data->Sumw2();
 data->Draw("ep")
Thanks a lot!
_ROOT Version:5.34
Platform: Not Provided
Compiler: Not Provided