Errors and contours of fit parameters


Please read tips for efficient and successful posting and posting code

ROOT Version: 6.20/05
Platform: Ubuntu 16.04
Compiler: gcc 5.4


Dear experts,

I’m doing a least square fit with a custom class implementing double operator() (const double *par), called by fitter.FitFCN(npars, global_chi2, 0, datasize, true).
I’m having problems in understanding how the parameter errors are calculated.

  1. If I compare the standard errors from Minuit2 (using the error matrix) with the errors from Minos, I found the same values.
    See the plots of the chi2 scan (obtained with fitter.Result().Scan) for two parameters. The red lines are the standard errors, while the blue lines are the Minos errors.


    As you see, the red and blue lines are on top of each other for both parameters.
    However, the intercepts with the chi2 curves do not make sense to me.
    I set Minuit ErrorDef to 1, so I was expecting the errors from Minos to correspond to the parameter values for which chi2 = chi2_min + 1, but this is clearly not the case: for He_delta, the difference in chi2 is ~11, while for He_gamma is ~43.
    Is there something I don’t understand?

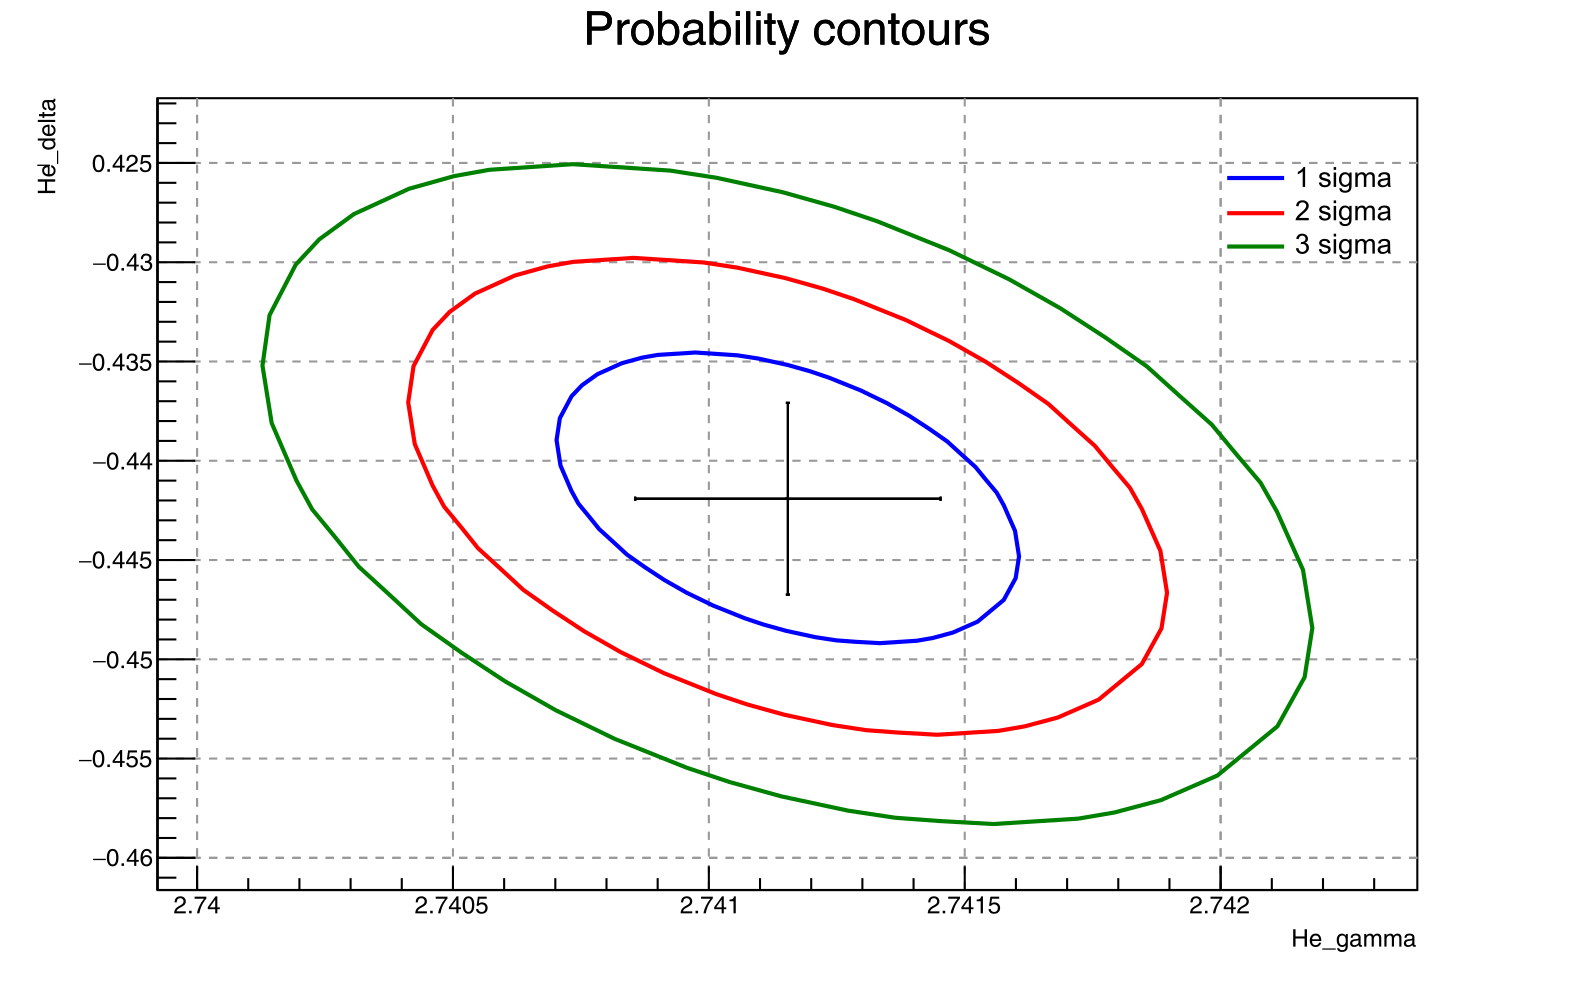
  2. I compute the 2D contours for various sigma levels (using SetErrorDef(TMath::ChisquareQuantile(TMath::Erf(s/TMath::Sqrt2()), 2)), s = 1, 2, or 3).


    The marker at the center is the best fit value, with the error bars given by the standard Minuit errors (which are equal to Minos errors, as pointed above).
    Again, I’m confused.
    I thought that the 1 sigma Minos errors for one parameter would be equal to the leftmost and rightmost edge of the 2D 1 sigma contour, as written in The interpretation of errors - James, but as you can see it’s not the case.
    Am I doing something wrong?

  3. Since my chi2/ndf is not 1 (it’s ~13, very bad, I know…), I used fitter.FitConfig().SetNormErrors() to rescale the parameter errors by sqrt(chi2/ndf), but nothing changed.
    Is this because FitFCN does not internally set fFitType = ROOT::Math::FitMethodFunction::kLeastSquare?
    Is there a way to tell Fitter that I’m performing a least square fit?
    Apparently, the last argument to FitFcn (chi2 = true) doesn’t do this.

  4. Related to the previous point: it looks like Minos errors are not rescaled by sqrt(chi2/ndf).
    Can I simply multiply Minos errors by sqrt(chi2/ndf) or is this wrong?

  5. I can compute the confidence interval of the fitted model with fitter.FitResults().GetConfidenceIntervals, asking to rescale the interval by sqrt(chi2/ndf), but in this case there is an additional term from the Student distribution, which should be used only when the measurement uncertainties are unknown.
    However, I know the uncertainties of my data points, so in theory it would be more correct to just multiply the interval by sqrt(chi2/ndf), right?

Thanks.

1 Like

Anybody?

@moneta or @StephanH Can you advise?

Hi @ccorti,

@moneta is the expert, but in the mean time, I wanted to bring up some things I noticed:

  1. ErrorDef + 1 should refer to -2 log-likelihood, shouldn’t it? I think this doesn’t work for chi^2. This may be why the delta chi^2 is not what you expected.
  2. I thought SetErrorDef takes sigmas. So you should be putting 1, 2, 3.
  3. Also not familiar. I usually do log-likelihood fits …

Hi,

  1. ErrorDef is used to define the level of the FCN (the minimisation function) for which the error is computed in Minuit. It works for whatever function you minimise. Now, I really do not understand your plots. I am sure Minuit/Minos it is correct in computing the errors, so there is something weird in your case. Either the plots are wrong or somewhat you are setting a different ErrorDef value.

  2. ErrorDef does not take sigma’s but Delta(FCN) values. So for contours in 2 parameters, the value for which you have a contour at 68% CL, is correctly written above:
    TMath::ChisquareQuantile(TMath::Erf(s/TMath::Sqrt2()), 2), since TMath::Erf(s/TMath::Sqrt2() = 0.68
    Note that this is not the same value of 1-sigma error when projecting in 1-dimension.
    In the cited above F. James note (page 10) it is written that the 1-sigma contour for two parameters has a probability content of 39.3 % (i.e ROOT::Math::chisquared_cdf(1,2))

  3. It is true that SetNormErrors works only in case of least-square fits. It is used for example in the case of TGraph fits in ROOT, where there are no provided uncertainties. It corrects the computed parabolic errors (not the Minos ones) after fitting

  4. For Minos errors it would be better to scale the ErrorDef value by chi2/ndf, which is equivalent as scaling all your measured uncertainties by a sqrt(chi2/ndf) as you suggest in (5). However if you know you uncertainties and you are confident, I am not sure this is a correct procedure.
    You can get a larger chi2/ndf probably because your fit model is not correct or because your data are not normally distributed. In this last case better estimating uncertainties with another method (e.g. bootstrapping) and in the former trying different model functions and maybe estimate a systematics errors in your parameters from the difference obtained.

Best regards

Lorenzo

Hi Lorenzo,

  1. If I have only one free parameter, then Minos errors correspond exactly to the parameter values for which FCN = FCNmin + 1, as expected.
    I’ll try to do more debugging to understand why I get the weird results in my plots when I have more than one free parameter.

  2. You’re right, I misunderstood the part where it was saying that the extremal points of the contour correspond to the Minos errors: that’s only true for ErrorDef = 1, but then the 2D contour does not contain 68% of probability.

3, 4. Ok, thanks.

@moneta: I understand why the delta chi2 in the plots is not 1.
I thought fitter.Result().Scan was returning the chi2 profile for the parameter of interest by minimizing FCN with respect to the other parameters, like Minos does, but instead is just computing the FCN keeping the other parameters fixed to their best-fit value, hence correlations are not taken into account and the profile is narrow.
Is there a way to obtain a proper 1D contour for each parameter? I don’t see any other functions related to this in FitResult or Minuit2Minimizer, besides Scan.
I guess I can always compute the profile manually: for each parameter, fix it to different values and repeat the fit, each time getting the minimum FCN.

Hi,

What you see now in the plots make sense. If you don’t “profile” the FCN you get a much narrower curve. Unfortunately we don’t have this function computing the profile likelihood (i.e. fix one parameter and find the minimum with respect to the other parameters) in the Minimizer or FitResult classes
However this function exists in RooFit, RooAbsReal::createProfile. We should probably add also in the Minimizer.

Lorenzo

This topic was automatically closed 14 days after the last reply. New replies are no longer allowed.