Hello,
I am having some problems getting the error bars I want on a histogram. As an example, here is the kind of error bars I would want (the checkered bits):
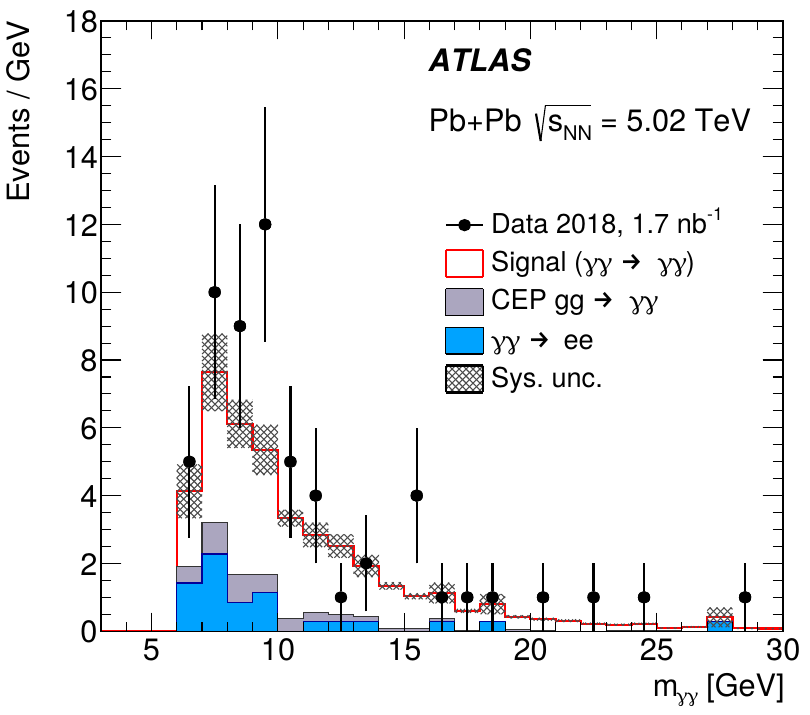
I understood that the way to obtain such an effect is to use the draw option “E4”, but once I try to apply this in my code, the histogram disappears. However, it reappears if I use histogram.Draw(“h”). I must also mention that I am using ATLAS Style. I have attached the code that I am using to produce the histogram.
Thank you,
Patrick.
code.zip (1.9 KB)