Hi,
I am using TGraphAsymmErrors and I would like to be able to set both my x and y range. Changing the x range seems to work fine. But when I change the y range the error band goes haywire. This is with root version 5.12.00.
Here is a simple example
#define BINS 9

Int_t test()
{
  TVectorD * x= new TVectorD(BINS);
  TVectorD * y= new TVectorD(BINS);
  TVectorD * xe= new TVectorD(BINS);
  TVectorD  ye[2];

  for(Int_t ie=0; ie < 2; ie++ )
      ye[ie]=new TVectorD(BINS);

  for(Int_t ix=0; ix < BINS; ix++ )
    {
      x(ix)=ix;
      y(ix)=3*ix+2;
      xe(ix)=0;
      for(Int_t ie=0; ie < 2; ie++ )
	ye[ie][ix]=sqrt(y(ix));

    }

  TGraphAsymmErrors * gr = new TGraphAsymmErrors(*x,*y,*xe,*xe,ye[0],ye[1]);
  gr->SetFillColor(14);
  gr->SetFillStyle(3002);
  gr->GetXaxis()->SetLimits(-10,20);
  gr->GetHistogram()->SetMaximum(20);
  gr->GetHistogram()->SetMinimum(-20);
  gr->Draw("3CA");

}
I have attached the resulting graph.
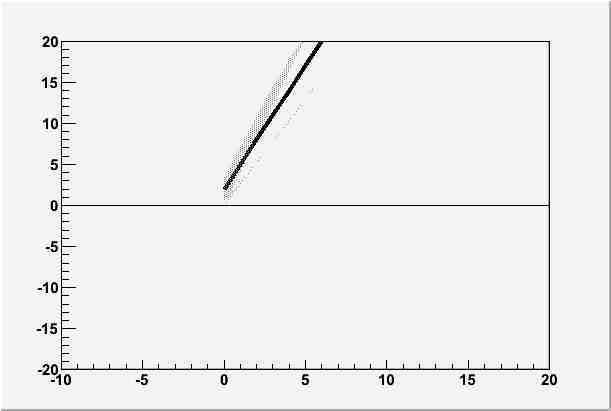
test.ps (8.92 KB)