I an trying to fit using erf function from TMath, and struggling very much not getting it quite right. Can I kindly have some help this fit?
Here is the sample fitting macro that I have used:
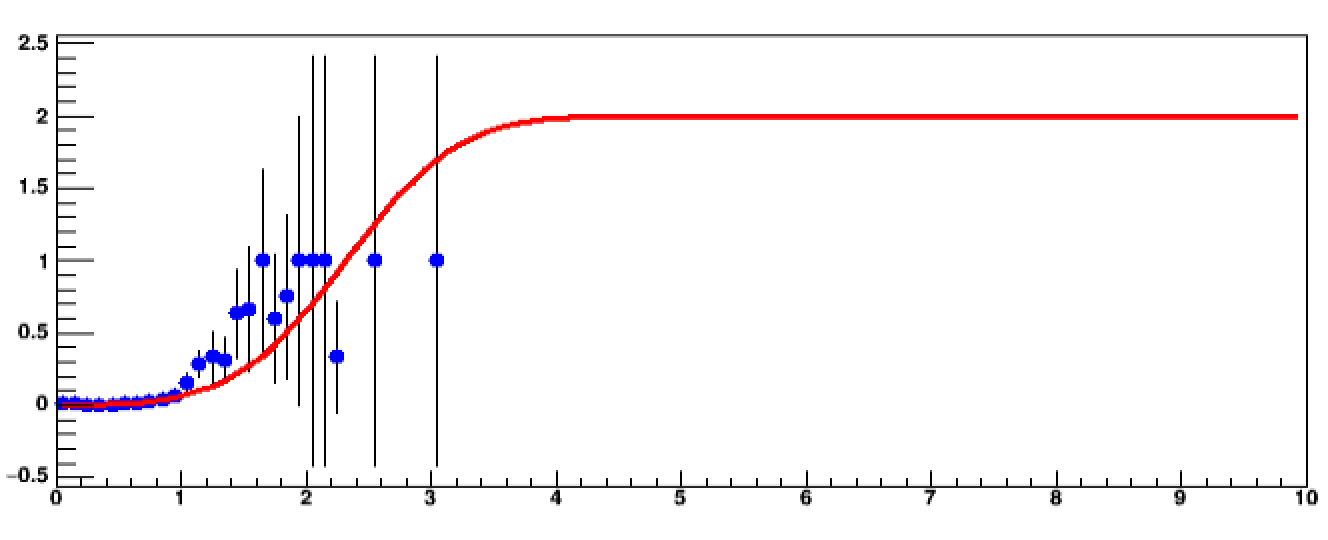
TF1 *myFit1T1 = new TF1(“myFit1T1”,“1 -TMath::Erf(-(x - [0]))”, 0. , 10);
myFit1T1->SetLineColor(kRed);
hratio_e_mb_sect0->Fit(“myFit1T1”,“QR+”);//fitting here
hratio_e_mb_sect0->SetMarkerColor(kBlue);
hratio_e_mb_sect0->Draw(“P”);
Hi,
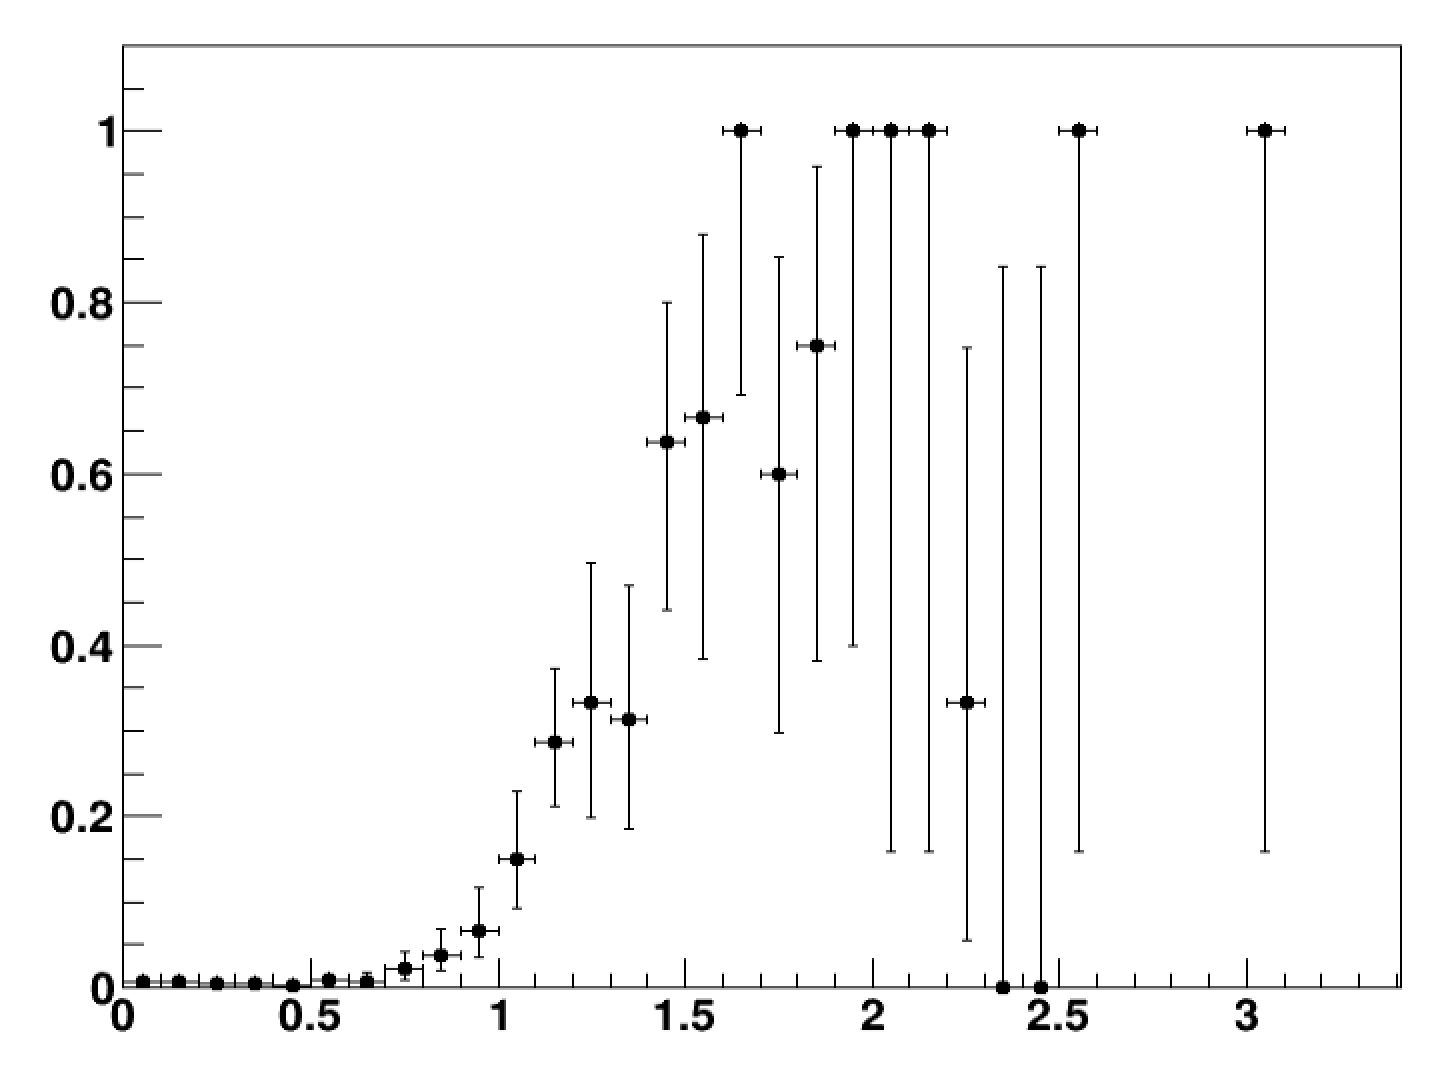
I think the problem is in the error of your data. They look to me far too large for points with y value closer to 1 and too small for points closer to 0.
Is this an efficiency curve obtained from an histogram ratio ? In that case the correct way is to use the TEfficiency class and TEfficiency::Fit.
When using TH1::Divide the uncertainty are propagated using standard error propagation, which is not correct in division of counts, which can be binomial or just Poisson ratio.
Then when fitting, you should use the correct ratio point distribution (eg .binomial), and this is done by performing a max. likelihood fit in TEfficiency::Fit.