I have data of around 900 million entries that I want to split into subgroups. I am plotting a quantity (pT) over a range from 0 to 1000 GeV, where each subgroup will contain approximately the same number of entries (enough statistics per subgroup). To achieve this, I have applied a cumulative distribution function (CDF) to my histogram, but I’m not sure how to split this cumulative histogram into multiple subgroups with the same statistics.
Could you please provide me with a solution on how to acheive that ?
Hi @Mustaphaa,
I attach a simple code to find the ranges to divide a distribution in equally populated sample. Cumulative.C (1.8 KB)
Below you find two pictures obtained with my code.
In the top part of each picture you have your distribution, and in the bottom part the cumulative obtained after scaling it back to one.
What I do is divide in equal part the y axis of cumulative distribution, then search for the bin where y reach these specific value. The division is way more precise when there are more bin in the first distribution and so also in the cumulative
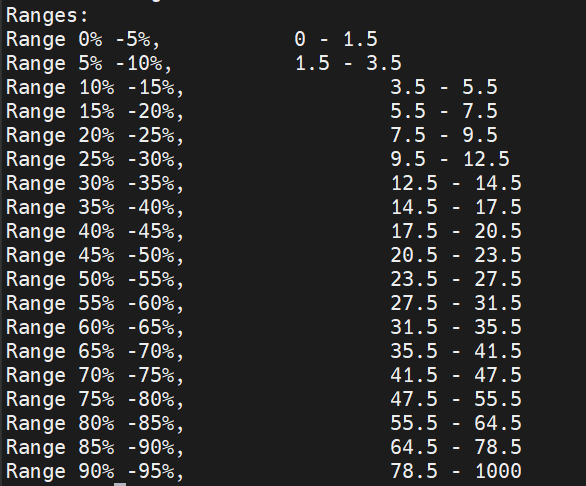
Thank you for the code you provided; it works properly. However, I noticed a small issue with the “last range”. It is quite large in terms of limits, as shown in the attached image. Currently, it spans from 78 to 1000. I’m wondering if it is possible to make it smaller, perhaps between 300 and 1000 or so.
Normally, I don’t have enough data for a range from 130 to 1000 GeV compared to the range from 0 to 130 GeV.
If you notice that the data size for each range is too small, maybe is better to increase to 10% or 15% the size of your samples. This should change also the size of the last one and second last one range. If you increase the bins number to 5000 the division will be more precise
To approximately achieve the last two ranges like this:
Range Before Last: 120 - 300
Range Last: 300 - 1000
I set the step size to 0.0001, and it produced ranges similar to these. However, upon inspecting the number of entries in each range, I noticed that the first few ranges had too many entries, and some ranges were repeated.
The reason I set the step size to 0.0001 is that I know there are only around 90K entries between 200 and 1000 GeV, and I thought this would be the only way to achieve such ranges(last two or three).
Hi,
I was able to find a solution.
The only thing to do was to increase the numbers of bin of the first histogram. I used 50000000 (5e7) as bin number. With just few bins the cumulative was not precise enough
I used only the first 1% of the file, otherwise the macro took to long to run on my laptop. So my ranges have only ~900 events.
Below you find a screenshot of my ranges, with the events.
2nd EDIT
I run the macro with the full data set. These are the resutls, for the last ranges.
I checked quickly all the range and they all have ~90K events. Using 1e8 bins should improve the results. And maybe you can increase also a bit the step size.