Hi!
I need to plot an histogram so that all the bins visually have the same thickness, although their bins edges are not equally spaced.
This is what I have:
vector<Double_t> x = {0, 1, 2, 3, 4, 5, 10, 15, 30, 60, 90, 180};
vector<Double_t> y = {1.64881E+12, 2.46556E+12, 2.07401E+12, 1.74880E+12, 1.39893E+12, 3.31152E+12, 1.07018E+12, 1.18962E+12, 1.32606E+12, 6.79694E+11, 3.20520E+12};

void angularBinningSTerm () {
	TH1D * h = new TH1D("name", "title", y.size(), (Double_t * ) &x[0]);
	gStyle->SetOptStat(false);

	for (size_t i = 0; i < y.size(); i++)
		h->SetBinContent(i + 1, y[i]);

	h->Draw("HIST");
}
If you try to run this, you get a graph in which bins don’t have the same “thickness”.
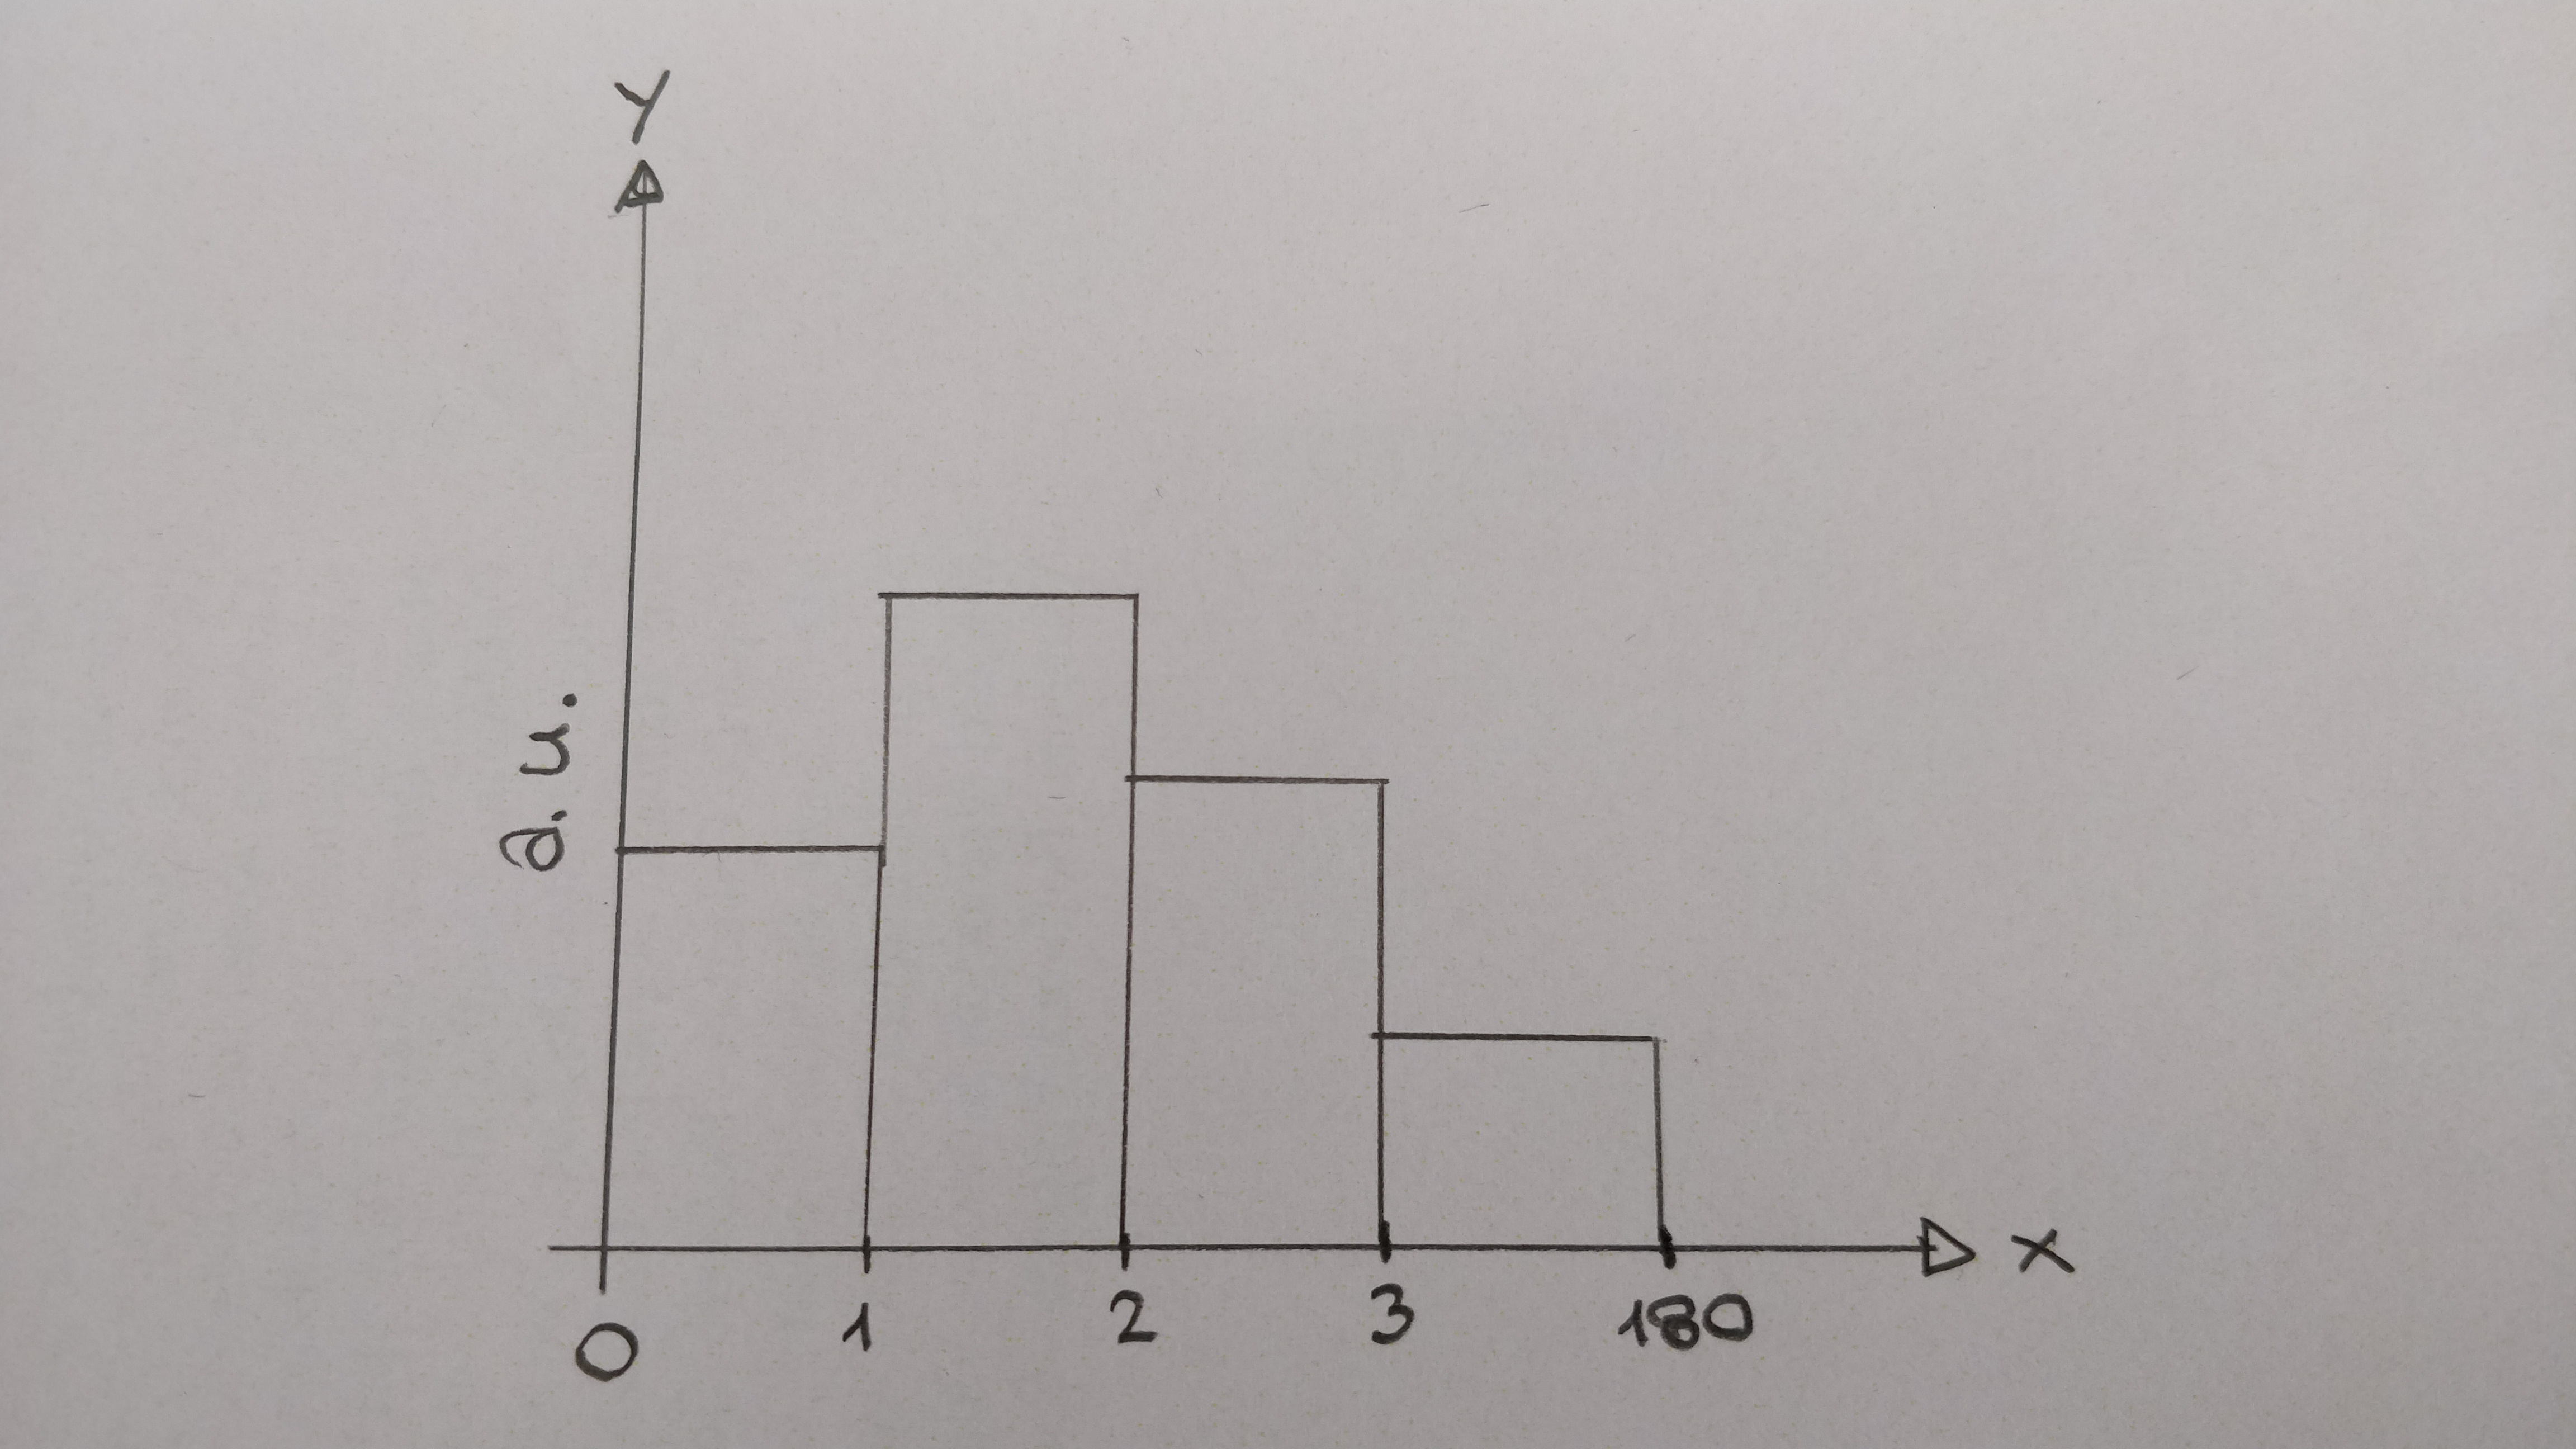
I want them to look like in this sketch:
even if the (bin_upper_edge - bin_lower_edge) is not a constant value.
As far as I know there’s no root module to do this… why don’t you just create a histogram with equal bin width and use SetBinLabel for the Xaxis? Or you can use TText and hard-coded draw the number right at the bin edge
Can you please explain this with an example or can at least give me some more indication on which method I should use?
You can look at thishttps://root.cern.ch/doc/master/classTText.html https://root.cern.ch/doc/master/classTAttText.html https://root.cern.ch/doc/master/classTString.html
Please try to use class reference extensively
// throw away original labels
    h->GetXaxis()->SetLabelOffset(9999);

    TText a;
    a.SetTextColor(kBlack);
    a.SetTextAlign(23);
    a.SetTextFont(41);
    a.SetTextSize(.03);
    for (int i = 0; i < x.size(); i++)
    {
      a.DrawText((double)i, h->GetMinimum() - (h->GetMaximum() - h->GetMinimum()) * .07, TString::Format("%.1f", x[i] ));
    }
RK
1 Like
Please try to use class reference extensively
This is what I’ve just done:
void angularBinningSTerm () {

	vector<Double_t> x = {0, 1, 2, 3, 4, 5, 10, 15, 30, 60, 90, 180};
	vector<Double_t> y = {1.64881E+12, 2.46556E+12, 2.07401E+12, 1.74880E+12, 1.39893E+12, 3.31152E+12, 1.07018E+12, 1.18962E+12, 1.32606E+12, 6.79694E+11, 3.20520E+12};

	TCanvas * c = new TCanvas("fileName", "window", 600, 400);

	TH1D * h = new TH1D("name", "title;x;y", y.size(), 0, y.size());
	gStyle->SetOptStat(false);

	for (Int_t i = 0; i < y.size(); i++)
		h->SetBinContent(i + 1, y[i]);

	h->GetXaxis()->CenterTitle(true);
	h->GetXaxis()->SetLabelSize(0);
	h->GetYaxis()->CenterTitle(true);
	h->GetYaxis()->SetLabelSize(0);
	h->GetYaxis()->SetTitleOffset(0.5);
	h->Draw("HIST");

    TText * a = new TText();
    a->SetTextColor(kBlack);
    a->SetTextAlign(23);
    a->SetTextFont(41);
    a->SetTextSize(.03);
    for (Int_t i = 0; i < x.size(); i++) {
		a->DrawText(h->GetXaxis()->GetBinLowEdge(i+1), h->GetMinimum() - (h->GetMaximum() - h->GetMinimum()) * .07, TString::Format("%.0f", x[i]));
	}

	x.clear();
	y.clear();
}
Thank you!
system
September 6, 2019, 8:19pm
6
This topic was automatically closed 14 days after the last reply. New replies are no longer allowed.