I would like to perform a sort of ensemble test by fitting a gaussian PDF to gaussian generated data. I have coded up something but for some reason my pull distributions are all off. The following with code is what I have done.
1: Generate a gaussian distribution with a mean of 100 and a width of 20 (I should specifiy that nentries = 1000 here)
TH1* genMC(TRandom3 *rng, TH1 *input) {
  if(input == 0x0) return 0x0;

  // Clone the histogram
  TH1 *output = (TH1*) input->Clone();

  long nentries = output->GetEntries();

  // Empty it out
  output->Reset();

  for(long i = 0; i < nentries; i++) {
    output->Fill(rng->Gaus(100, 20));
  }

  return(output);
}
2: I then pass this into a function that does the fitting using RooFit
Result doFit(TH1 *input_sideband, TH1 *input_signal, bool saveme) {
  Result res;

  double signal_region_count = input_signal->Integral(input_signal->FindBin(0), input_signal->FindBin(300));
  double sideband_region_count = input_sideband->Integral(input_sideband->FindBin(0), input_sideband->FindBin(300));

  RooRealVar gauss_mean("mean", "mean", 70, 50, 150);
  RooRealVar gauss_width("width", "width", 15, 0, 30);
  RooGaussian thresh("gauss", "Signal PDF", x, gauss_mean, gauss_width);

  RooDataHist data_sideband("data", "Yhea", x, input_sideband);
  x.setRange("fit", 0, 300);

  RooPlot *frame = 0x0;

  frame = x.frame();
  data_sideband.plotOn(frame, MarkerColor(1), LineColor(1));
  data_sideband.statOn(frame);
  // Generate the extended likelyhood stuff
  RooRealVar nbkg("nbkg", "Number of Background Events", 100, 0, 10000000);
  RooAddPdf bkgModel("BkgModel", "Background Model", RooArgList(thresh), RooArgList(nbkg));

  // Do the fit to the sidebands
  RooFitResult *fitResult_Sideband = bkgModel.fitTo(data_sideband, Extended(kTRUE), Range("fit"), Verbose(kTRUE), Save(kTRUE), Minos(kFALSE), PrintLevel(3$

  bkgModel.plotOn(frame, LineColor(kRed), LineStyle(2), Normalization(nbkg.getVal(), RooAbsReal::NumEvent));
  bkgModel.paramOn(frame, ShowConstants(kTRUE), Label("Fit Parameters"), Format("NEU", AutoPrecision(1)));

  int status = fitResult_Sideband->status();
  int covQual = fitResult_Sideband->covQual();
  cout << "The sideband fit status was: " << status << " with a covariance quality code of: " << covQual << endl;

  res.obs               = sideband_region_count;
  res.obs_err           = sqrt(res.obs);
  res.exp               = nbkg.getVal();
  res.exp_err           = nbkg.getError();
  res.delta             = res.obs - res.exp;
  res.pull              = res.delta / res.exp_err;
  res.side_fit_status   = fitResult_Sideband->status();
  res.side_cov_status   = fitResult_Sideband->covQual();
  res.mean              = gauss_mean.getVal();
  res.mean_err          = gauss_mean.getError();
  res.width             = gauss_width.getVal();
  res.width_err         = gauss_width.getError();

 return(res);
}
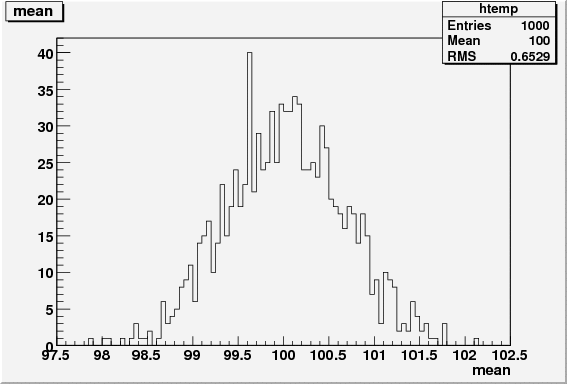
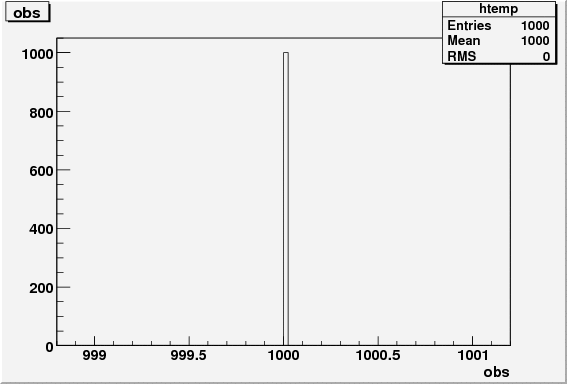
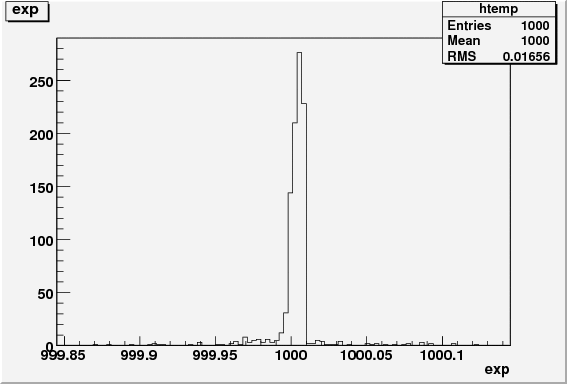
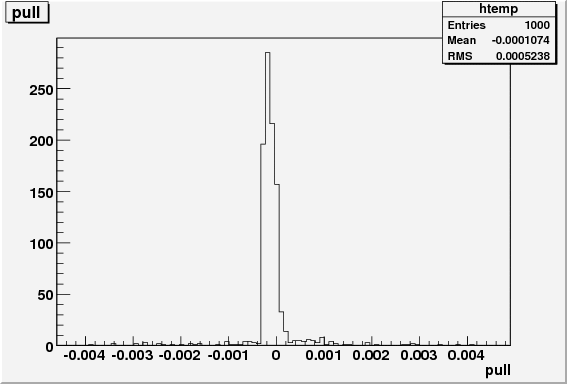
I do the above 1000 times and the Results are then saved into a root file for viewing. Now, I would expect to get a nice pull distribution centered at 0 with a width of 1. I do not. I have attached the pull distribution to this post so that you can see it. I have also included as an attachment the full code with all of its spaghetti glory. Is this a by product of me using the extended likelihood technique? Thanks for any help on this.
Justace


code.tar.gz (4.95 KB)