Dear Experts
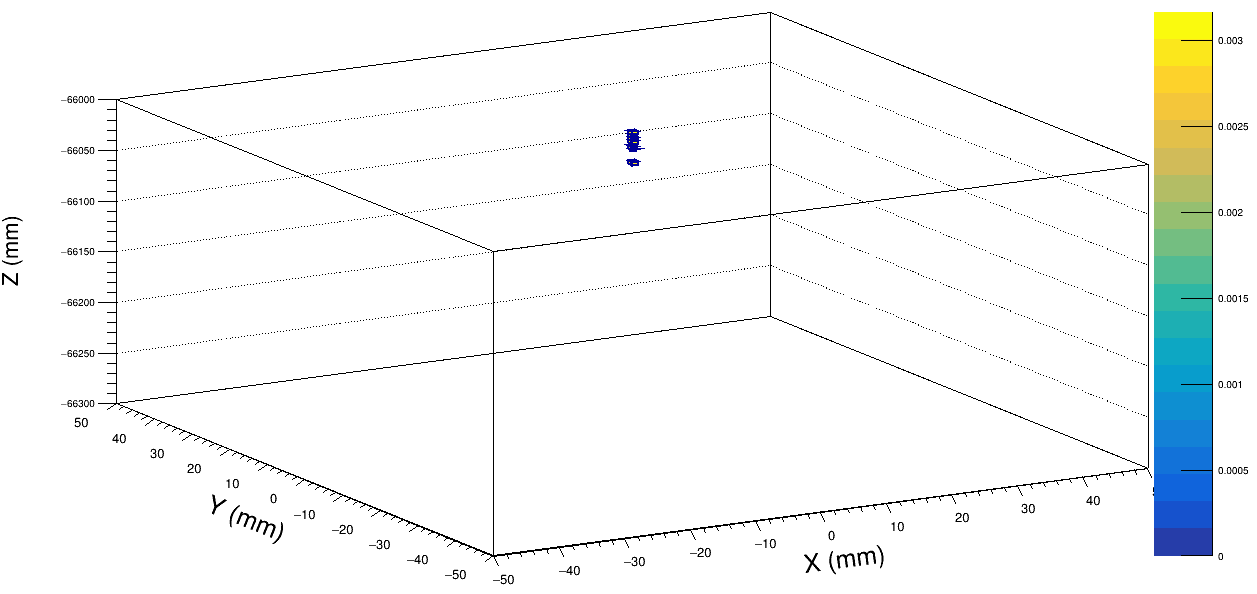
I want to plot energy distribution in 3D plot using the attached macro and Root file but I don’t see proper filling of histogram What is see is also attached in Screen shot. Please check my Macro and Suggest What could be wrong. Thanks
lumi3.edm4hep.root (3.0 MB)
Please read tips for efficient and successful posting and posting code
ROOT Version: Not Provided
Platform: Not Provided
Compiler: Not Provided
draw_Performance.C (3.2 KB)
In your ROOT files, there are only 10 events:
root -b -q lumi3.edm4hep.root -e 'events->Scan("MCParticles.generatorStatus");'
This makes no sense:
hist3->Fill(posX[iParticle], posY[iParticle], posZ[iParticle], energy[iParticle]);
Maybe you want:
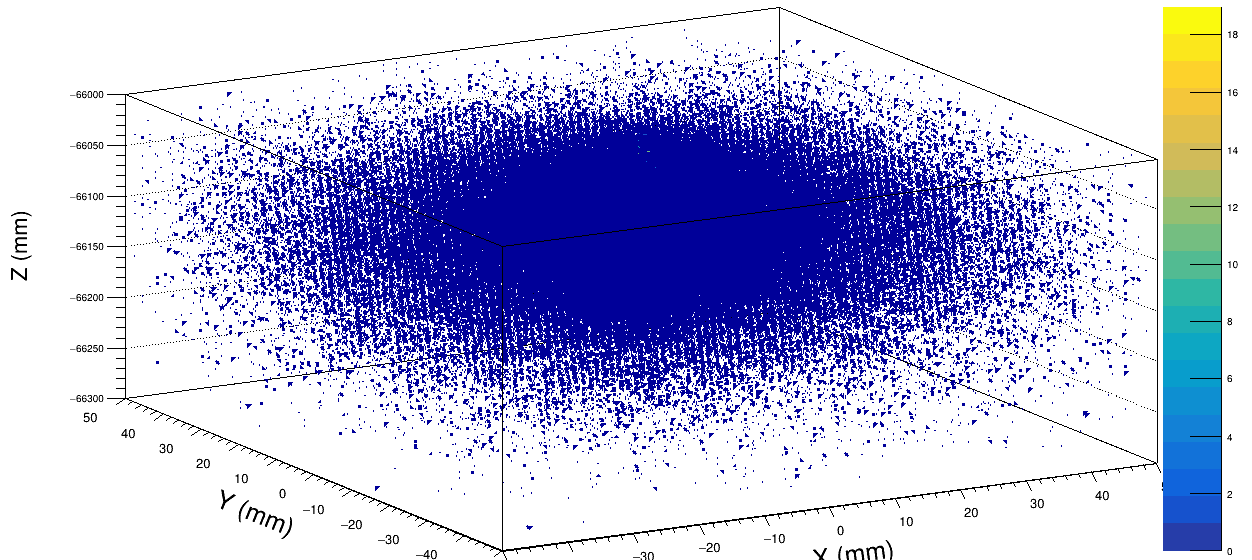
for (int iHit = 0; iHit < energy.GetSize(); iHit++)
  hist3->Fill(posX[iHit], posY[iHit], posZ[iHit], energy[iHit]);
Thanks @Wile_E_Coyote It worked and now I can see
This is for detector size 10cm x 10cm and I would like to see deposition in 1mm Can you Please suggest How can i plot that.
Thanks a lot
You can draw the inner part only, e.g.:
hist3->Draw("LEGO2Z");
hist3->GetXaxis()->SetRangeUser(-2., 2.);
hist3->GetYaxis()->SetRangeUser(-2., 2.);
hist3->GetZaxis()->SetRangeUser(-66150., -66000.);
if (gPad) { gPad->Modified(); gPad->Update(); }
Or you can create the histogram with small axes ranges, e.g.:
auto hist3 = new TH3F("X:Y:Z", "Hit position 3D", 40, -2., 2., 40, -2., 2., 50, -66150., -66000.);
Hi @ Wile_E_Coyote I have added some code to plot projections Now I want to see e.g., the energy deposit within a slice along the z axis. Please suggest How can i see that.
Part of my code is as follows:
for (map<string,TH3*>::const_iterator itr = h3.begin(); itr != h3.end(); itr++)
{
//gStyle->SetOptStat(0);
    string hname = itr->first;
    TH3* h = (TH3*)itr->second->Clone();
    h->Scale(1.0/float(h->Integral()));

    TCanvas* c = new TCanvas("c", "", 1000, 1000);

    TH2* h2yx = (TH2*)h->Project3D("yx")->Clone();

    c->cd();
    h2yx->Draw("colz");
    gPad->SetLogx(0); gPad->SetLogy(0); gPad->SetLogz(0);
    ss.str(""); ss << "test2D_yx_" << hname << ".png";
    c->SaveAs(TString(ss.str()));
Before doing the projection, try: h->GetZaxis()->SetRangeUser(some_z_min, some_z_max);
@ Wile_E_Coyote I tried this but does not produce slice in z axis Can You Please suggest the errors
   TH2* h1 = (TH2*)h->Project3D("z slice")->Clone();
    h1->GetZaxis()->SetRangeUser(zmin, zmax);
    h1->Draw("colz");
    gPad->SetLogx(0); gPad->SetLogy(1); gPad->SetLogz(0);
    ss.str(""); ss << "Zslice" << hname << ".png";
    c->SaveAs(TString(ss.str()));
I wrote: BEFORE
BTW. Read also: TH3::Project3D