Dear All sorry if this is trivial,
Does someone know why I have an empty graph if I use option F for drawing ?
Thanks in advance.
PS: the code can be run just by doing: root -l Efficiency.C
Cheers,
Diallo AtlasStyle.h (388 Bytes) Efficiency.C (11.1 KB)
Hi,
Thanks for replying, gr_eff_Prim_Vert_4e->Draw(“ALF”); doesn’t work neither, it just draws a line where I want to have a filled area.
Does it work for you ?
Cheers,
Diallo.
Hi,
I tried another graph in my previous message.
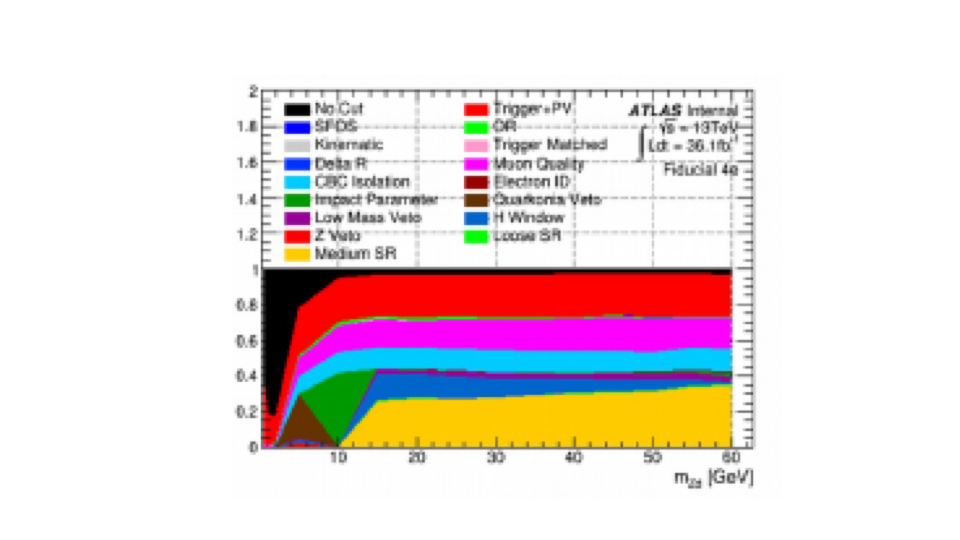
I used to use draw option “F” with histograms and it always works, or maybe I am mistaken but this example is what I am expected to have.
I think you are right about the meaning of option “F”, it doesn’t work as in histogram, for instance for different x, and y and by changed the color (this is what I missed in the message where I changed graph, otherwise it will be white by default and then invisible) it works but differently as I expected in the plot I attached.
So I still don’t know then how to reproduce this kind of plot I attached ?
Cheers,
Diallo.
You must make sure that the first and the last points of your graphs have y = 0 (if necessary, add two such points, the first one with x = xmin and the last one with x = xmax).