Hi,
Is it possible to draw a moving graph. e.g. a sliding window of 100 values from a large dataset (10000 values) updated every two seconds?
Many thanks,
Vlad
Hi,
Is it possible to draw a moving graph. e.g. a sliding window of 100 values from a large dataset (10000 values) updated every two seconds?
Many thanks,
Vlad
see example in tutorial seism.C
Rene
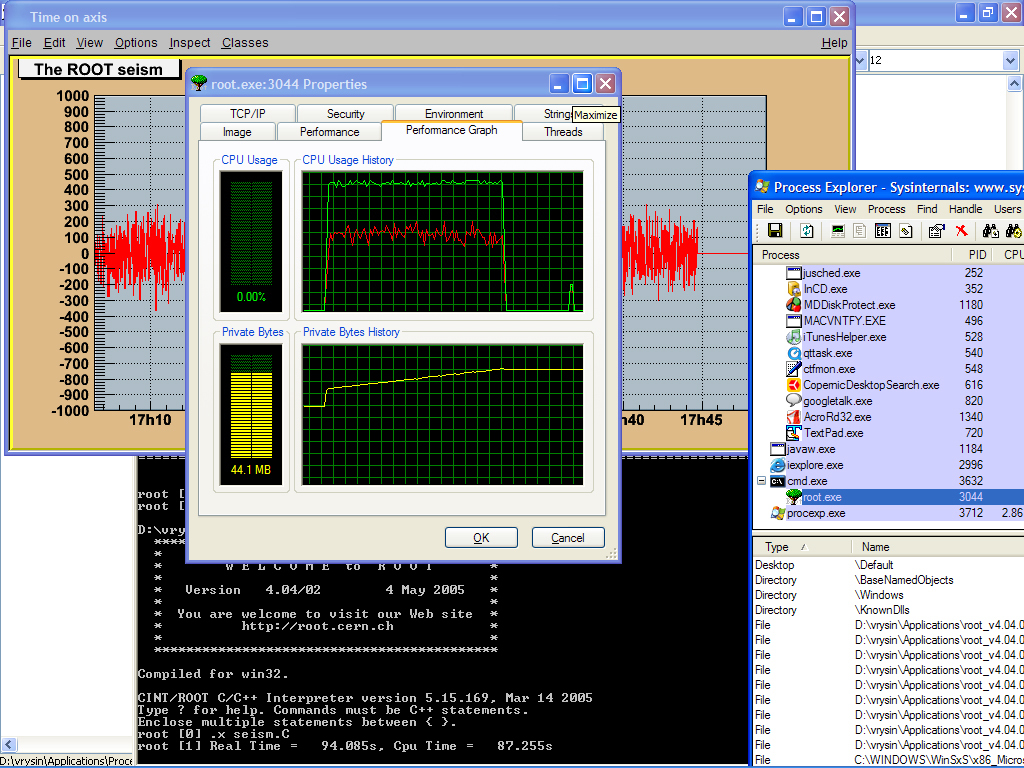
I ran a script of a “moving” TGraph and I noticed it was leaking memory. I tried deferent ways – same thing. Then I tried seism. It was leaking memory too. One run of seism grabs about 15MB of memory. Neither ->Reset() or delete help.
I run ROOT on Windows XP. I believe it is not a tier 1 platform for ROOT but I think it is not Windows this time.
Any ideas?
Thanks,
Vlad
I do not see any leak at all with seism.C.
You must be using a very old version.
Please always indicate which version you are using when posting to the Forum.
PS: Windows is a supported platform.
Rene
Sorry about version and other info information.
I run root v4.04.02
I included two files:
Thanks,
Vlad
Hi Vlad,
These problems of memory leaks have been solved in latest version.
Cheers,
Bertrand.