Draw problem : command terminal draw a different graph compare to my programm

Hello, i have a problem with my draw, because he work for the 9 graphs but for one he didn’t function.

void OMline2() {
//gStyle->SetOptStat(0);
//gStyle->SetOptFit(1111);

TCanvas *c1 = new TCanvas();

TFile *input = new TFile("/home/kdupuy/Documents/code_final/fichier_root/valeurspicstest.root",“READ”);

TTree tree = (TTree)input->Get(“valeurspicstest_tree;1”);

double Constant1, Mean1, Sigma1, om_number1;
int pics, intensity, Entries;
Double_t error1, error2, error3;
Double_t x[6], y[6],ex[6],ey[6];
Int_t n = 6;
Double_t fquality;

tree->SetBranchAddress(“om_number1”, &om_number1);
tree->SetBranchAddress(“Constant1”, &Constant1);
tree->SetBranchAddress(“Mean1”, &Mean1);
tree->SetBranchAddress(“Sigma1”, &Sigma1);
tree->SetBranchAddress(“pics”, &pics);
tree->SetBranchAddress(“intensity”, &intensity);
tree->SetBranchAddress(“error1”, &error1);
tree->SetBranchAddress(“error2”, &error2);
tree->SetBranchAddress(“error3”, &error3);
tree->SetBranchAddress(“fquality”, &fquality);
tree->SetBranchAddress(“Entries”, &Entries);

int entries = tree->GetEntries();

for (int j = 0; j <=12; j++ )
{
TF1 fit7 = new TF1(“fit7”, “pol2”, 60,130);
TGraph
gr = new TGraphErrors(n,x,y,ex,ey);
for (int i=0; i < entries; i++)
{
tree->GetEntry(i);

  if (om_number1 == j && Entries > 600 ) //&& fquality < 2.2)
  {
        cout << "pics" << pics<< endl;
        x[pics] = intensity;
        cout <<"itensity ==" << intensity << endl;
        cout <<"Mean ==" << Mean1 << endl;

        y[pics] = Mean1;

        cout << "Mean2" << y[pics] << endl;
        cout << error2 << endl;
        ey[pics] = error2;

        ex[pics] = 0;


   }
   if (om_number1 == j && Entries < 600)
   {
     gr->RemovePoint(pics);
   }

}

//printf(“Number of points before RemovePoint: %d\n”, gr->GetN());
//printf(“Number of points after RemovePoint: %d\n”, gr->GetN());

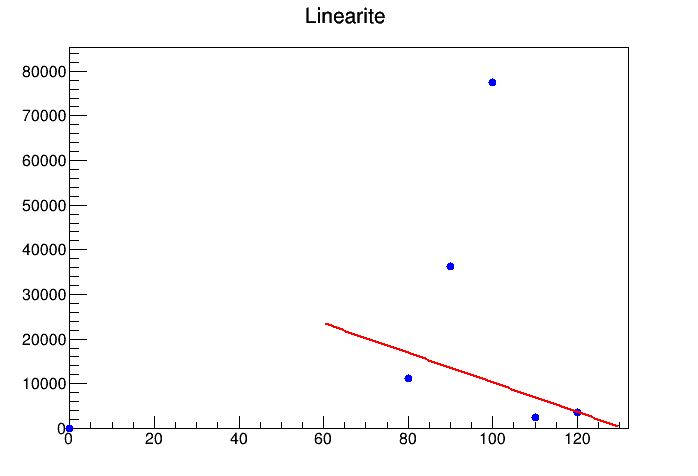
gr->SetTitle(“Linearite “);
gr->SetMarkerColor(4);
gr->SetMarkerStyle(20);
gr->Draw(“AP”);
gr->Fit(“fit7”,“R”);
c1->Print(Form(”/home/kdupuy/Documents/code_final/Line2/%03i.png”, j));
//delete gr;
}

}


valeurspicstest.root (11.3 KB)

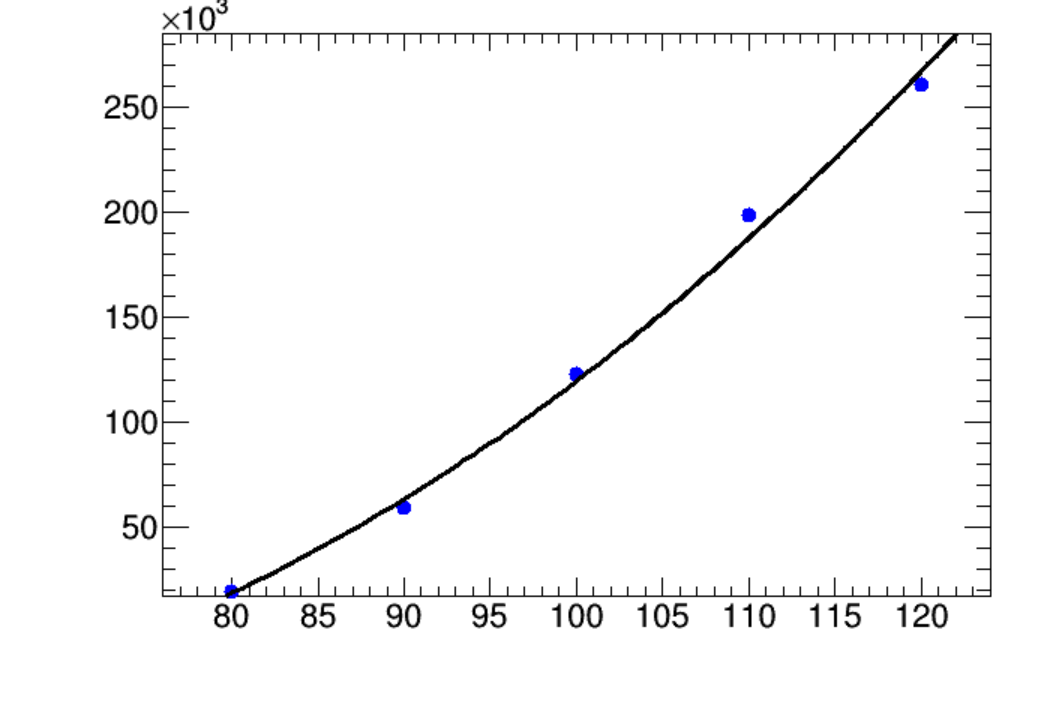
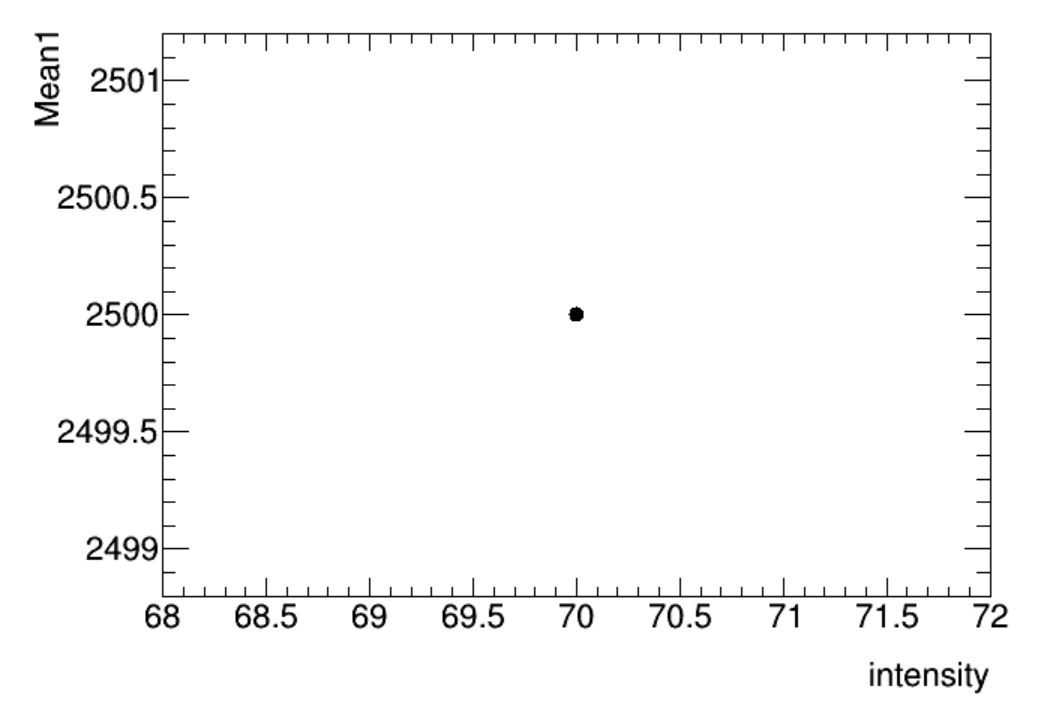
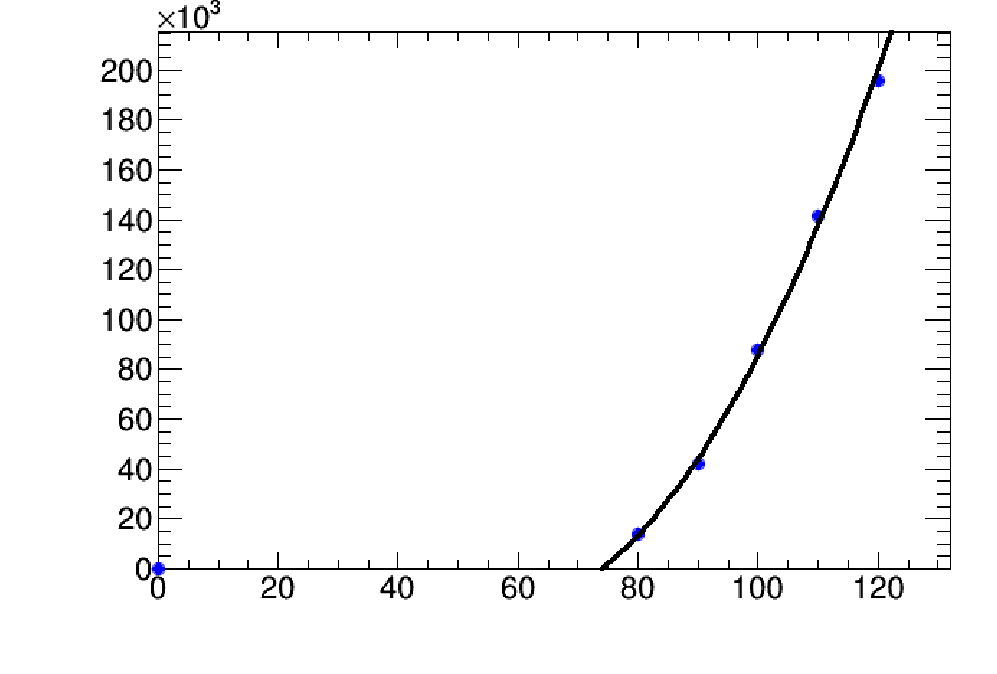
When i draw i see that for the problem’s draw :

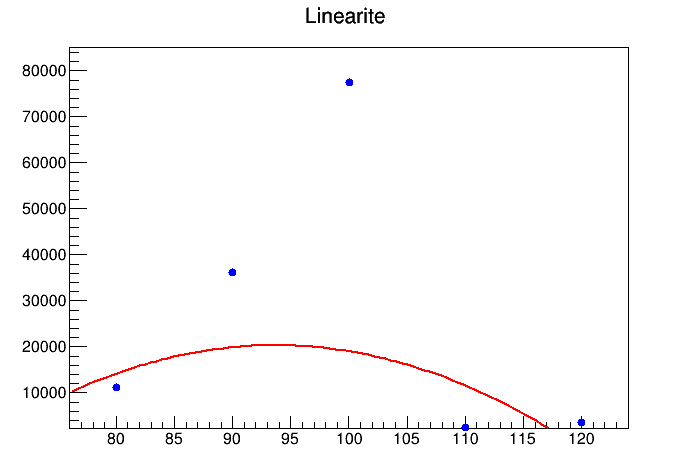
But when i draw with the command : valeurspicstest_tree->Draw(“Mean1:intensity”,“om_number1 == 10 && Entries < 600”), in can draw it without problem

Hi,

could you maybe explain what you think is wrong with this plot of yours? What did you expect and what did you get?

For what it’s worth, I get a different plot when running your code:

And when I do the following

valeurspicstest_tree->Draw("Mean1:intensity", "om_number1 == 10 && Entries < 600")

from CLI I get

When i run my code i get this :


for j = 10 and i don’t understand why.

Ah, this is for j=10 only. I didn’t understand it from your initial question. Yes, I reproduced this plot now. I’ll try to figure out what’s wrong here.

Thank you sorry for my bad explanation

I think I sorted it out. In your code you call the constructor

TGraph* gr = new TGraphErrors(n,x,y,ex,ey);

before you defined the n, x, y, ex, and ey. This does not make sense. The graph probably takes the values from the previous tree entry this way. To fix it, you have to move the constructor to where your

for (int i=0; i < entries; i++)
{...}

loop finishes. This way I get the following for j=10:

I didn’t remove the point at (0, 0) since this removal is now before the constructor, and it will take a few moments from your side to fix this one, too.

I think that all your plots were incorrect because of this issue, not only the one for j=10.

Thank you, yes it works well for all my plots now.

Sorry but if you draw j = 0 ; j<=10 the problem moves to the previous one.
I get this for j = 9

Right, this is because for om_number1 == 9 you should only have 4 points:

  • x=0 (pics=0; should be removed as Entries < 600)
  • x=80 (pics=1; should be removed as Entries < 600)
  • x=110 (pics=4)
  • x=120 (pics=5)

But somehow you have additional points with pics=2 and 3. These guys probably come from the previous entry, as you don’t clear the x and y arrays between the entries.

Oh yes thank you so i use that for clean x and y :

for (int i=0; i <= 5; i++)
{
x[i] = 0;
y[i] = 0;
}

So now i search a solution for remove the point 0,0

Usually this point appears when you have one point left uninitialized, so its coordinates default to (0, 0). In the constructor you have

Int_t n = 6;
...
TGraph* gr = new TGraphErrors(n,x,y,ex,ey);

, so all your graphs must have exaclty 6 points. Is that the case really? Can’t you have less points for some particular j? Also, are you sure pics can equal 0? If not, there goes your uninitialized point.

All graphs have 6 points because i save 6 Mean1 for one “j”. J in my case is a detector.
But when i draw Mean1 as function of intensity i apply a condition :

if (om_number1 == j && Entries > 600 )

But in certain case Entries is < 600 so he didn’t take account of them and he draw this coordinates.
For resolve this problem i use :

if (om_number1 == j && Entries < 600)

       {
         gr->RemovePoint(pics);
       }

But if we use Tgraph gr after that i can’t use them. So i search a solution for exclude this.

TGraph* gr = new TGraphErrors(n,x,y,ex,ey);

Note that n doesn’t have to be the same size as x (y…); it can be smaller, to use the first n elements. You can take advantage of that if you do it carefully.

1 Like

I guess you can save the point numbers you wish to exclude in a vector while you calculate the point coordinates, and as soon as your graph is ready (as soon as the constructor is called), you can loop over that vector and remove each point by its number. And then you draw your graph. Just be careful and make sure you clear that vector when you go to the next entry or you’ll end up without any points left on the plot by the time you come to j=12.

1 Like