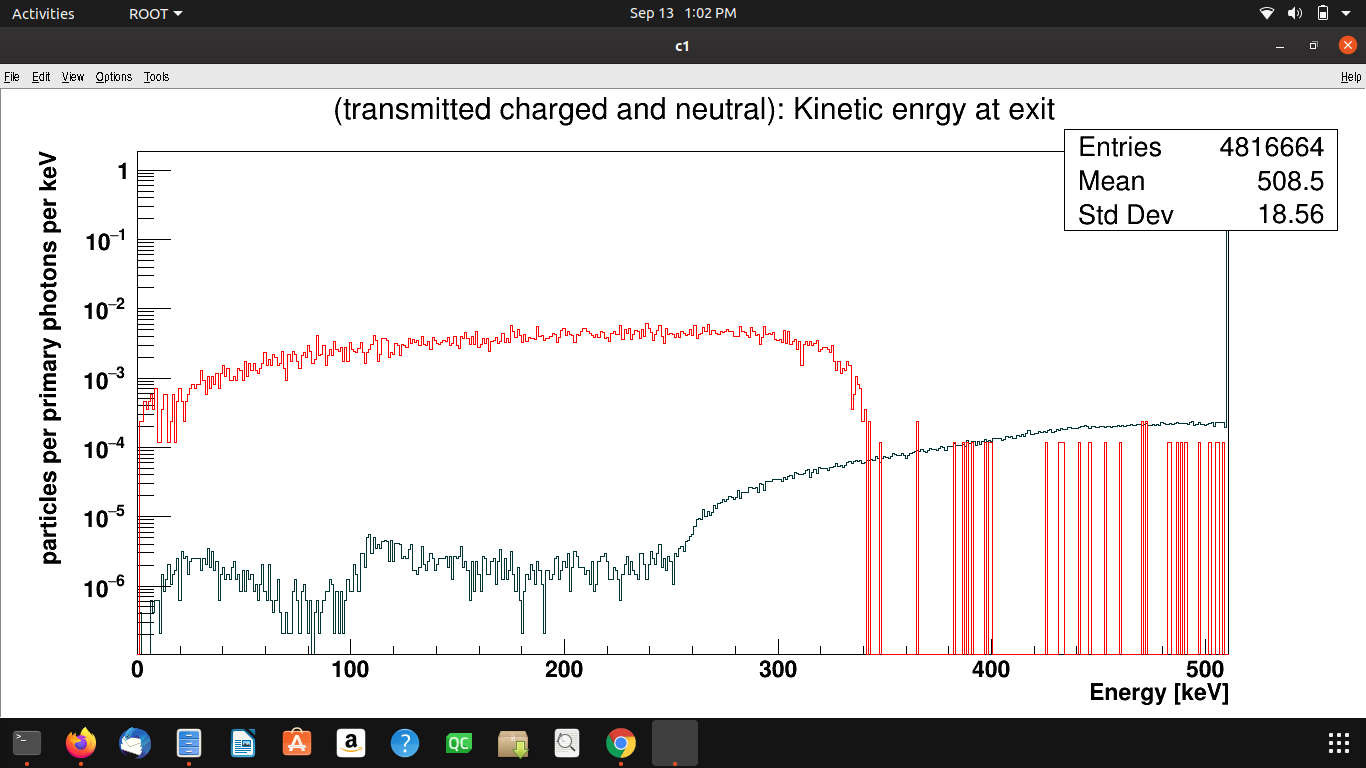
Hi want to draw line instead of zigzag line as here in attachment.!
Screenshot from 2020-09-13 13-02-28|690x387
Hi Muhammad,
try drawing your histogram using
hist->Draw("C");
It will draw a smooth curve through the histogram bins.
Hi @yus I tried but it draw small circles at the top but not a smooth curve .
A histogram is a representation of counts; the line you see corresponds to the counts of how often each bin was filled. Changing the line means changing the histogram contents - which means showing not the data you have but data you believe to be better. The deviations from the “perfect line” are important, though - they give an indication what the uncertainty is.
I see two options:
- show a fit, i.e. a function that parameterizes your histogram.
- use larger bin widths; you can try for instance
hist->Rebin(4)
Cheers, Axel.