Hello Experts,
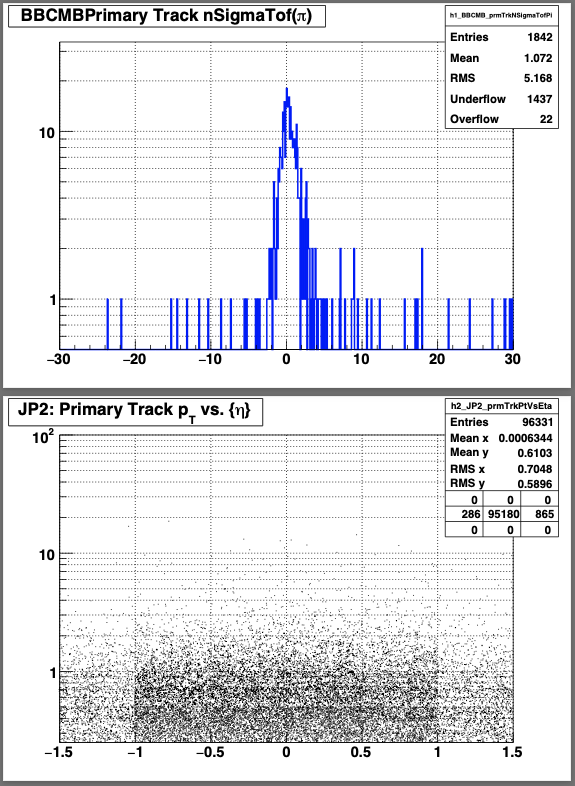
I the macro shown below, I loop over a root file that has both TH1 and TH2 histograms. I was to plot these histograms in the order they appear in the file. Over all, the macro achieves that goal, but there is one thing that the macro is not doing as expected. For the TH2 histogram, I set h2->Draw("COLZ"), but the 2D histograms that are saved in the output pdf file do not have a COLZ color scheme. Attached is an image of a sample output. The 1D histograms look exactly as I expected them, but not the 2D histograms. Can you please point me to how I had fix this? Thank you very much in advance!
Plotting macro:
void plotGenerator()
{
        TString inputFileName = TString("./qaTest_pAu200_16157035.hist.root");
        TFile* inputFile      = new TFile(inputFileName.Data());

        TIter keyList(inputFile->GetListOfKeys());
        TKey *key;
        TCanvas c1;
        c1.Print("plots_qaTest_pAu200_16157035.pdf[");
        //c1.Print("tofQAPlots_AllRuns_in_runList2.pdf[");
        while ((key = (TKey*)keyList())) {
                TClass *cl = gROOT->GetClass(key->GetClassName());
                if(cl->InheritsFrom("TH1")) {
                        TH1 *h1 = (TH1*)key->ReadObj();
                        string histoName = h1->GetName(); // could be const char* type too
                        cout << h1->GetName() << endl;
                        c1.SetLogy();
                        gStyle->SetOptDate(0);
                        gStyle->SetOptStat(111111);
                        h1->SetLineWidth(2);
                        h1->SetLineColor(kBlue);
                        h1->Draw("hist");
                        c1.Print("plots_qaTest_pAu200_16157035.pdf");
                        delete h1;
                } // End of if(cl->InheritsFrom("TH1"))
                else if(cl->InheritsFrom("TH2")) {
                        TH2 *h2 = (TH2*)key->ReadObj();
                        string histoName = h2->GetName(); // could be const char* type too
                        cout << h2->GetName() << endl;
                        //c1.SetLogz();
                        gStyle->SetOptDate(0);
                        gStyle->SetOptStat(111111);
                        gStyle->SetOptStat(111111);
                        gStyle->SetStatY(0.99);
                        gStyle->SetStatX(0.9);
                        gStyle->SetStatW(0.2);
                        gStyle->SetStatH(0.12);
                        Float_t yAxisMin = h2->GetYaxis()->GetXmin();
                        Float_t yAxisMax = h2->GetYaxis()->GetXmax();
                        Float_t xAxisMin = h2->GetXaxis()->GetXmin();
                        Float_t xAxisMax = h2->GetXaxis()->GetXmax();
                        TPaletteAxis *palette = new TPaletteAxis(xAxisMax+0.3, yAxisMin, xAxisMax+1., yAxisMax,h2);
                        h2->GetListOfFunctions()->Add(palette,"br");
                        //h2->SetOption("colz");
                        h2->Draw("COLZ");
                        c1.Print("plots_qaTest_pAu200_16157035.pdf");
                        delete h2;
                } // End of else if (cl->InheritsFrom("TH2"))*/
                //c1.Print("plots_qaTest_pAu200_16157035.pdf");
                c1.Clear();

        } // End of while ((key = (TKey*)keyList()))
        c1.Print("plots_qaTest_pAu200_16157035.pdf]");
        //c1.Print("tofQAPlots_AllRuns_in_runList2.pdf]");
} // End of void plotGenerator()