Dear rooter,
I’d like to monitor many (thousands of) root files, each of which contains tens of histograms by a java script tool : root.cern.ch/js/ . The benefit of this fantastic tool is displaying root files via a Browser like Firefox, without necessity to run under ROOT environment. Which is obviously very attractive to do a monitoring job.
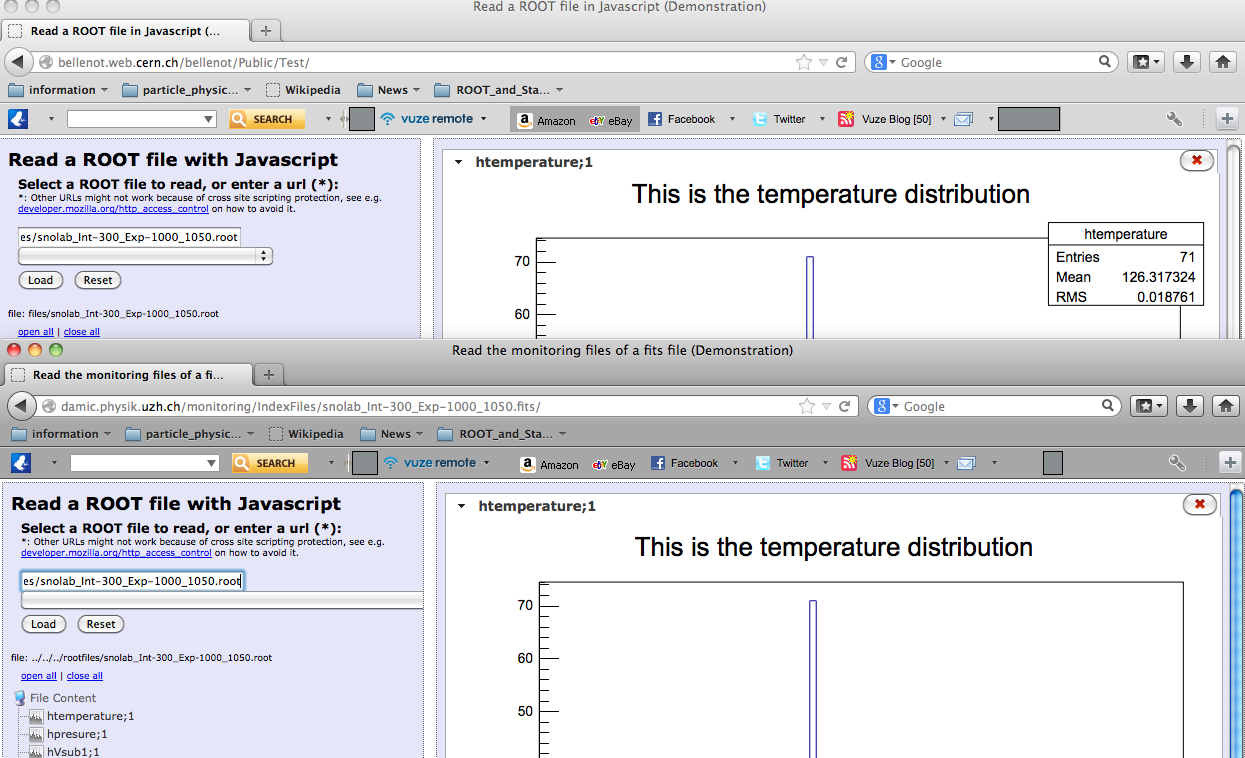
All of the root files on the tutorial link(root.cern.ch/js/) works well on my own monitoring website.
Unfortunately, the histograms produced by myself can’t display their statistical box properly(the histogram itself is very normal) - the boxes are all disappeared.
And the statistical boxes of same root files can be displayed correctly if I open it under ROOT.
Although the developer of the java script has promised to improve this in a few months later, I still hope I can get some supports here in parallel.
After comparing one of the files(hsimple.C) which produced hsimple.root and my script. I realized the difference probably is the hsimple.C has called histo->Draw() and histo->update() which save the statistical box into histograms.
In my case, however, I can’t call histo->Draw() and histo->update() since I need to produce tens of histograms for every root file in a remote machine - it’s too slow to do it.
In my script, I open a histogram, fill it and write it into a file.
I don’t know if there is any alternative way to save a statistical into a histogram, except Draw() and update() ?
Thanks ahead !
Junhui
The fake code of my scrip is :
TFile define;
Histo define ;
for( loop ) Histo->Fill();
gStyle->SetOptStat(1); (this line doesn't matter much in fact)
Histo->Write();
Histo->Delete();
The code of hsimple.C is ,
TFile *hsimple(Int_t get=0)
{
//  This program creates :
//    - a one dimensional histogram
//    - a two dimensional histogram
//    - a profile histogram
//    - a memory-resident ntuple
//
//  These objects are filled with some random numbers and saved on a file.
//  If get=1 the macro returns a pointer to the TFile of "hsimple.root"
//          if this file exists, otherwise it is created.
//  The file "hsimple.root" is created in $ROOTSYS/tutorials if the caller has
//  write access to this directory, otherwise the file is created in $PWD

   TString filename = "hsimple.root";
   TString dir = gSystem->UnixPathName(gInterpreter->GetCurrentMacroName());
   dir.ReplaceAll("hsimple.C","");
   dir.ReplaceAll("/./","/");
   TFile *hfile = 0;
   if (get) {
      // if the argument get =1 return the file "hsimple.root"
      // if the file does not exist, it is created
      TString fullPath = dir+"hsimple.root";
      if (!gSystem->AccessPathName(fullPath,kFileExists)) {
	 hfile = TFile::Open(fullPath); //in $ROOTSYS/tutorials
         if (hfile) return hfile;
      }
      //otherwise try $PWD/hsimple.root
      if (!gSystem->AccessPathName("hsimple.root",kFileExists)) {
         hfile = TFile::Open("hsimple.root"); //in current dir
         if (hfile) return hfile;
      }
   }
   //no hsimple.root file found. Must generate it !
   //generate hsimple.root in $ROOTSYS/tutorials if we have write access
   if (!gSystem->AccessPathName(dir,kWritePermission)) {
      filename = dir+"hsimple.root";
   } else if (!gSystem->AccessPathName(".",kWritePermission)) {
      //otherwise generate hsimple.root in the current directory
   } else {
      printf("you must run the script in a directory with write access\n");
      return 0;
   }
   hfile = (TFile*)gROOT->FindObject(filename); if (hfile) hfile->Close();
   hfile = new TFile(filename,"RECREATE","Demo ROOT file with histograms");

   // Create some histograms, a profile histogram and an ntuple
   TH1F *hpx = new TH1F("hpx","This is the px distribution",100,-4,4);
   hpx->SetFillColor(48);
   TH2F *hpxpy = new TH2F("hpxpy","py vs px",40,-4,4,40,-4,4);
   TProfile *hprof = new TProfile("hprof","Profile of pz versus px",100,-4,4,0,20);
   TNtuple *ntuple = new TNtuple("ntuple","Demo ntuple","px:py:pz:random:i");

   gBenchmark->Start("hsimple");

   // Create a new canvas.
   TCanvas *c1 = new TCanvas("c1","Dynamic Filling Example",200,10,700,500);
   c1->SetFillColor(42);
   c1->GetFrame()->SetFillColor(21);
   c1->GetFrame()->SetBorderSize(6);
   c1->GetFrame()->SetBorderMode(-1);


   // Fill histograms randomly
   TRandom3 random;
   Float_t px, py, pz;
   const Int_t kUPDATE = 1000;
   for (Int_t i = 0; i < 25000; i++) {
      random.Rannor(px,py);
      pz = px*px + py*py;
      Float_t rnd = random.Rndm(1);
      hpx->Fill(px);
      hpxpy->Fill(px,py);
      hprof->Fill(px,pz);
      ntuple->Fill(px,py,pz,rnd,i);
      if (i && (i%kUPDATE) == 0) {
         if (i == kUPDATE) hpx->Draw();
         c1->Modified();
         c1->Update();
         if (gSystem->ProcessEvents())
            break;
      }
   }
   gBenchmark->Show("hsimple");

   // Save all objects in this file
   hpx->SetFillColor(0);
   hfile->Write();
   hpx->SetFillColor(48);
   c1->Modified();
   return hfile;

// Note that the file is automatically close when application terminates
// or when the file destructor is called.
}


 …
…