measure1 |-------o----------|
measure2 |------o------|
measure3 |-----------o------------|
value on x-axis 0.0 1.0 2.0 3.0 4.0
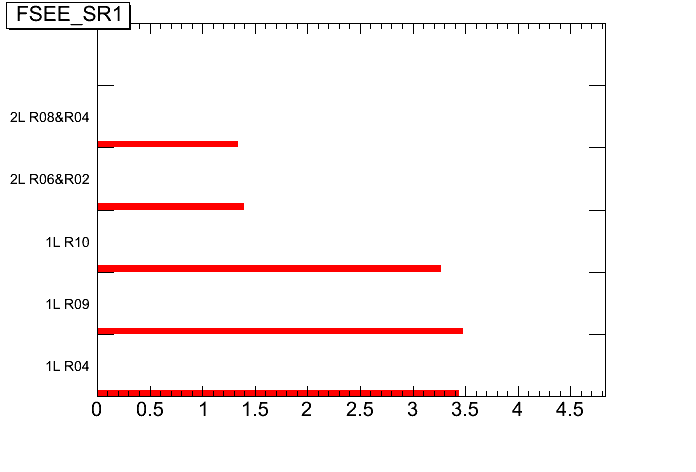
I tried by filling the histograms with the points and the errors, put them into a stack, and draw with the hbar option (that rotates the histogram), but that just results in the attached plot, which shows bars going from 0 and up, while I really want just exactly what is shown in this simple illustration.
What I need is a set of points with errors that are displayed vertically over each other. Where the y-axis represents the different measurements, and the x-axis represents the measurement point with errors.
I can’t see how setting the error-bar on the y-axis (I presume you now mean on the y-axis of the original TH1F histogram?) to zero will help this?
I attach some pseudo-code showing what I have done up until now. (it is in python, but that does not matter)
""" iterating over a dictionary containing the values
I use in the histograms
"""
for region,est in sorted(summary_dict.items()):

    asymErr.SetPoint(0,7.0,mean)
    asymErr.SetPointError(0,0.,0.,minval,maxval)
    asymErr.SetLineColor(kRed);asymErr.SetLineWidth(2)
    asymErr.Print()

    h_1.SetBinContent(1,est[0])
    h_2.SetBinContent(2,est[2])
    h_3.SetBinContent(3,est[4])
    h_4.SetBinContent(4,est[6])
    h_5.SetBinContent(5,est[8])

    h_1.SetBinError(1,est[1])
    h_2.SetBinError(2,est[3])
    h_3.SetBinError(3,est[5])
    h_4.SetBinError(4,est[7])
    h_5.SetBinError(5,est[9])


    mg.Add(h_1);mg.Add(h_2);mg.Add(h_3);mg.Add(h_4);mg.Add(h_5);
    mg.SetTitle(region)

    mg.Draw("px0e nostack")
    asymErr.Draw("pe same")
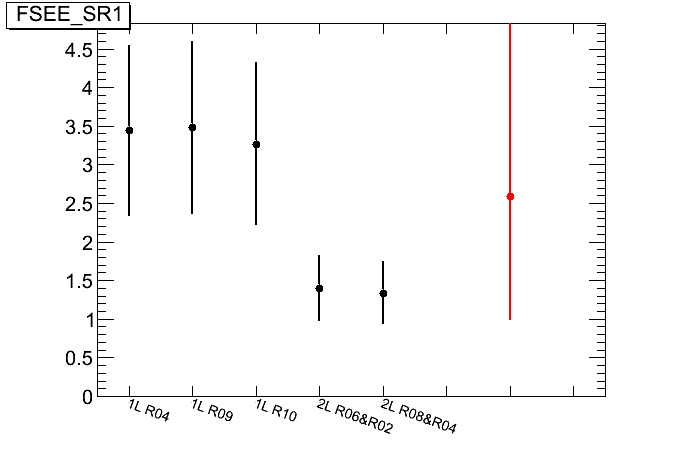
This produces something like the attached plot. But I would like it rotated 90 degrees. In addition I would like to be able to draw the mean value out of the points. There should exist some tool for all this? (of course, I can easily calculate the mean value it myself, but I just wonder if something is already in place for these types of things)
By the way, I see I have done this unnecessarily complicated, but that is due to have started with TGraph, and placing the various graphs vertically above each other, but then switching to TH1F and going horizontal again, and trying to use hbar to rotate the result.