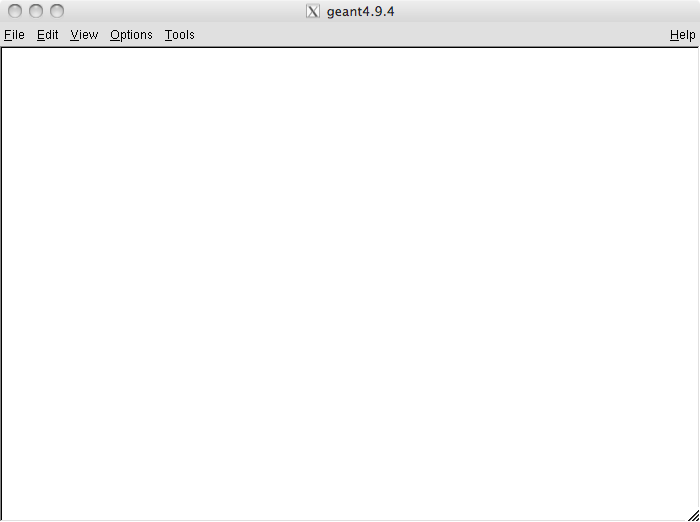
We just updated ROOT from 5.24 to 5.34/17. To test, I created a canvas and tried to subdivide it into 2x2 pads and draw ntuples in them. However, the canvas remained blank. Even the pad boundaries remained invisible; I could tell by moving the mouse over the canvas that it had been subdivided but none of the borders is visible. (Image attached.) Could this be a missing driver or some other component in our 5.34 upgrade? The same commands in 5.24 would subdivide the canvas and display the data.
Thanks,
Neil
Borders are invisible - that’s the “new style” in the last 6 years. Can you, please, show your macro or at least describe its structure - I’m interested why ntuple is not visible.
Thanks for the help. Here are the commands I used to load a .root file (created in 5.24) and draw the ntuple in each of the pads:
[fazel@linux10 /u8/fazel]$ root -l
root [0] TFile f(“geant4_output_4_9_4_electron.root”)
root [1] c1=new TCanvas(“c1”, “geant4.9.4”)
(class TCanvas*)0xc161f70
root [2] c1->Divide(2,2)
root [3] c1->cd(1)
(class TVirtualPad*)0xbf80510
root [4] ntuple->Draw(“x:y”)
root [5] c1->cd(2)
(class TVirtualPad*)0xbf80790
root [6] ntuple->Draw(“x:y”,“x>-5 && x<5 && y>-5 && y<5”)
(Long64_t)(-1)
root [7] c1->cd(3)
(class TVirtualPad*)0xbf80a10
root [8] ntuple->Draw(“x:y:z”)
root [9] c1->cd(4)
(class TVirtualPad*)0xbf80d90
root [10] ntuple->Draw(“x:y:z”)
root [11]
The file being loaded is here:
dropbox.com/s/4de7szrnj6cv4 … ctron.root
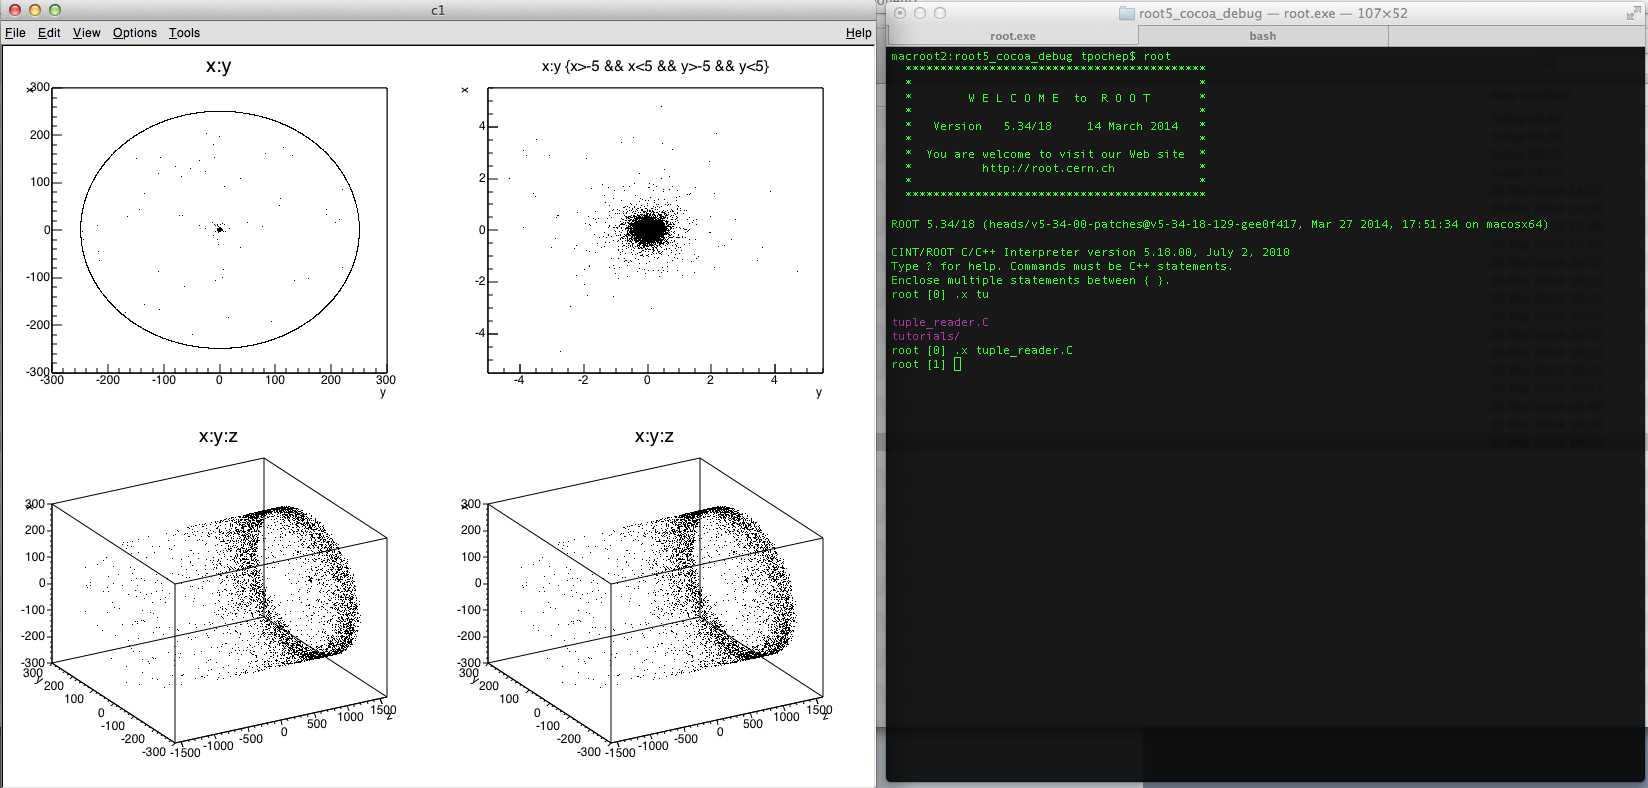
When I run these commands in 5.24, I get the image shown here:
[url]Rectangular artifact when visualizing in 3D
Thanks,
Neil
With the code/data you provided I can not reproduce the problem you’ve mentioned. Neither executing as sequence of commands in a command shell, nor executing as a macro.
BTW. I probably misunderstood something. You never mentioned the OS you have and just by looking at your screenshot I’ve assumed you have an OS X. But now I can also see [X] in the title bar, so it must be XQuartz?
I tried both Cocoa and X11 versions on OS X and can not reproduce the problem you’ve described.
Thanks for looking into this and the feedback. Sorry for the omission regarding OS. I connected (using ssh -X) from a Mac (running Snow Leopard) to a Linux machine and ran ROOT remotely on the Linux host. The X you saw was probably because the window was a client of the X11 server application running on the Mac. I also tried this directly from the linux computer terminal (i.e. not remotely), and got the same result. So it doesn’t seem that the Mac is involved.
Is it possible that some visualization component is missing in my environment, e.g. libGraf3d.so? I’m saying that because linking C++ code with root libraries started to complain about missing libGraf3d.so after switching to 5.34:
[url]Missing libGraf3d.so
Update: I confirmed that root-graf3d has not been installed; could that explain the display problems?
Thanks,
Neil
[quote=“nbfazel”]Update: I confirmed that root-graf3d has not been installed; could that explain the display problems?
Thanks,
Neil[/quote]
No, I don’t think so (but try to build/install ROOT correctly to check this??) - you would see an error/warning about missing library from ROOT. Also, Draw(“x:y”) does not require anything from graf3d IMHO.
This week I had to work with ROOT installed on a remote machine with Scientific Linux 6 and
XQuartz (on my side) - everything seems to be ok, but I’ll try your data/commands later when I have an access to my mac/this remote machine again.
[quote=“tpochep”][quote=“nbfazel”]Update: I confirmed that root-graf3d has not been installed; could that explain the display problems?
[/quote]
No, I don’t think so (but try to build/install ROOT correctly to check this??) - you would see an error/warning about missing library from ROOT. Also, Draw(“x:y”) does not require anything from graf3d IMHO.
[/quote]
Thanks. I’m waiting for our sys admin to install root-graf3d; then I’ll give it a try. Is root-graf3d part of the standard install of ROOT?
BTW, I am able to draw and display histograms; it’s only ntuples that don’t display.
Update: I tried with root-graf3d installed and got the same result (as you predicted). The problem seems to be with the ntuple on 5.34 itself not just displaying it. I can’t even scan its data (it returns -1, i.e. error):
ROOT 5.34:
root [2] ntuple->Scan()
(Long64_t)(-1)
root [3]
ROOT 5.24:
root [0] TFile f(“geant4_output_4_9_4_electron.root”)
root [1] .ls
TFile** geant4_output_4_9_4_electron.root
TFile* geant4_output_4_9_4_electron.root
KEY: TH1F geant4_output_4_9_6_electron;1 KE distribution: geant4_output_4_9_6_electron
KEY: TNtuple ntuple;1 data from ascii file
root [2] ntuple->Scan()
- Row * KE * x * y * z * Px * Py * Pz *
-
0 * 19.852300 * -0.001886 * 0.0084945 * 1361.8499 * 0.0025348 * 0.0109102 * 0.9999369 *
-
1 * 19.879800 * -0.006425 * -0.000252 * 1361.8499 * -0.018760 * 0.0412766 * 0.9989719 *
-
2 * 19.8778 * -0.010942 * 0.0147658 * 1361.8499 * -0.008754 * 0.0540913 * 0.9984980 *
-
3 * 19.8202 * -0.000529 * 0.0013973 * 1361.8499 * -0.011488 * 0.0134674 * 0.9998430 *
It’ only the ntuple that has a problem; the histogram is fine and I can draw it.
Thanks,
Neil
Update: this seems to be related to missing libraries; see here:
http://root.cern.ch/phpBB3/viewtopic.php?f=3&t=17867