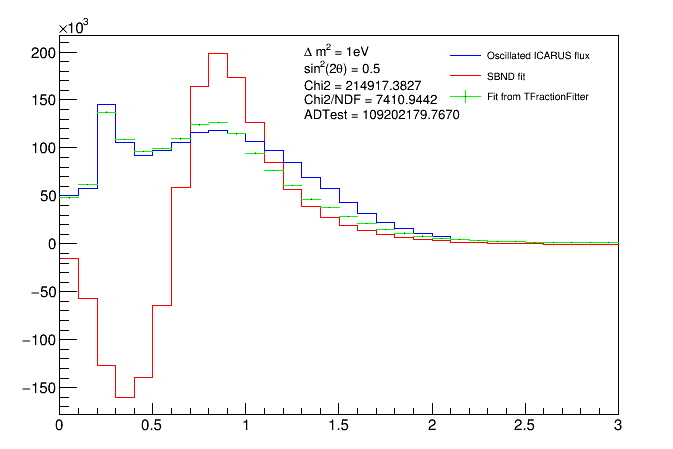
I use TFractionFitter to fit my far detector flux to a 6 different fluxes at the near detector. My aim to get the coefficients in this linear combination and then use those 6 coefficients elsewhere. Below is one such sample fit:
Here: blue is the original far detector flux that I want to fit. green is the plot from fit->GetPlot();
and red is me manually talking those weights using fit->GetResult(i, w0, e0) and then making a new histogram (h_new) using >>
( h0->Scale(w0);
h_new -> Add(h0) ). (h0 is the corresponding histogram that I add to the tobjectarray.
I do this for all the sets of weights and the corresponding near detector histograms.
My question is, how is the red line so much different than the green if they should be conveying the same information?
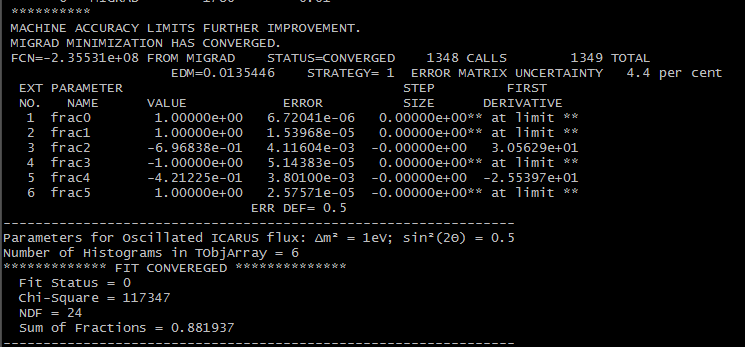
PS: here is the output from the terminal for the fit if necessary
Are you expecting that some of the fractions are negative ? I am not sure if TFractionFitter can really support this case, I would need to double check it.
Also I am not sure if thee fit really worked well, since the solution you have you get fractions at the limit (1 or -1). For the other parameters the derivatives is very large, indicating this is not really a minimum.
Concerning the plot, when adding the MC histogram to perform their linear combination sum, you need to normalise first to the data histogram and then scale by the fractions.
So you do