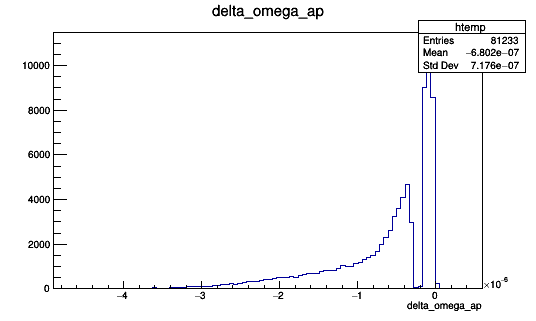
I am plotting a histogram with the results of fitting 81233 TGraph objects.
For the fit I define the function TF1 *Cosine = new TF1("Cosine", "[0]*cos([1]*x*1.e6 + [2])+[3]", 0., tmax) and then
Cosine->SetParameters(A0, omega*1.e-6, phi0, 0.);
Cosine->SetParLimits(0, -1., 1.);
Cosine->SetParLimits(2, 0., M_PI); //acos have a range of 0,pi

gr->Fit("Cosine", "WRM");
The problem is that as you can see in the plot attached, there are almost no values around -0.3. This does not makes sense physically (the distribution should be smooth and continuous), and I checked that the data I am fitting is correct. I suspect that there is a problem when I do the fit, but I can’t think of anything.
I guess you could draw this parameter ([1]) versus the chi^2 of the fit, versus another parameters, versus the graph number and see if you find any unexpected / strange “correlations”.
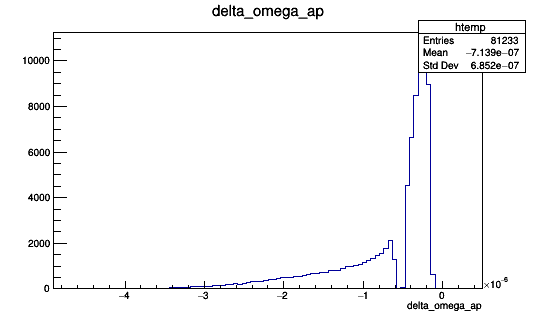
I did what you suggested, but I can´t find any strange correlation. I tried to give the -0.3e-6 as initial value, and as you can see in the plot attached, the gap is displaced now to -0.5e-6.
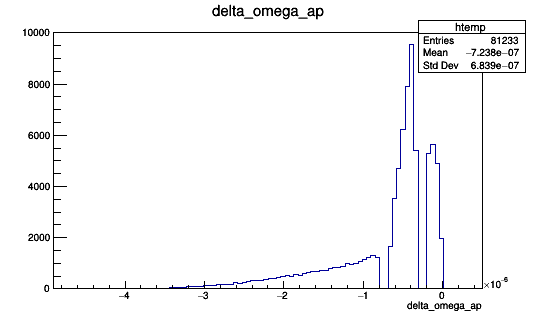
Giving now -0.5e-6 as initial value, the gap is displaced and a new ones appear. I am using the same data all the time. I believe this is a problem of the precision when fitting.
You can also try to inspect the: Int_t fitStatus = gr->Fit("Cosine", "WRM");
Search for “Access to the fit” (“result” and “status”) in the TGraph::Fit method description.