I have to fit these dates with a sine. The plot is ok and I obtain a good chi square. But I see this:
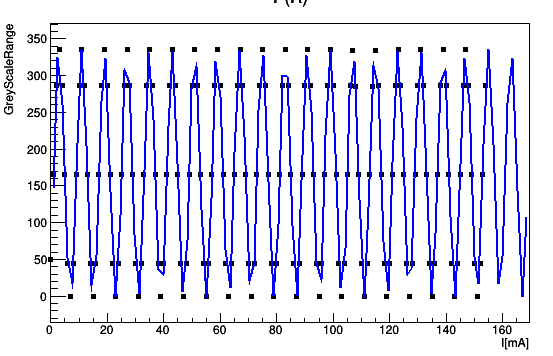
This is so strange but when i zoom it for example between 15 and 40 (where the fit is not good according to this picture) I obtain:
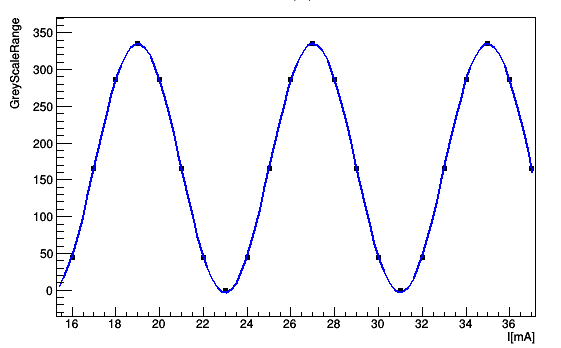
that agrees with the chi sqare
why?