Hello all,
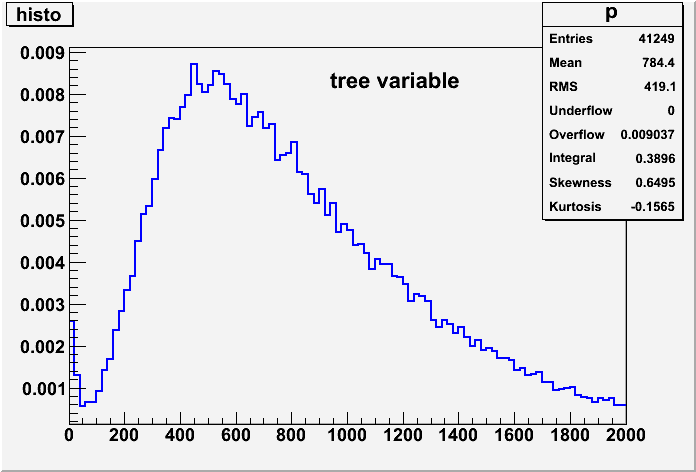
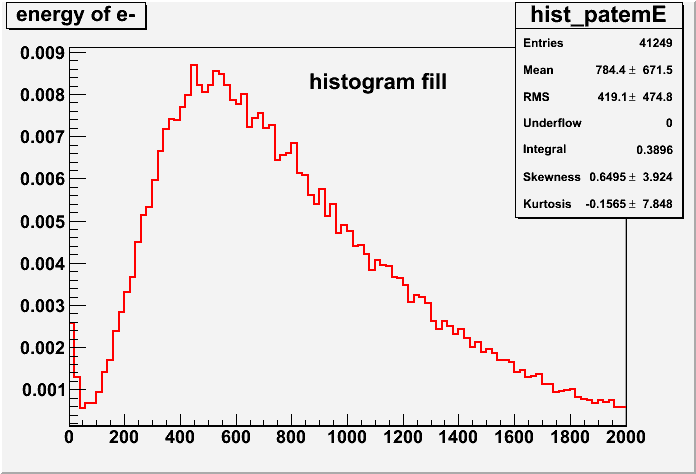
I have got two plots.
One with just filling the histogram in a code
hist_electronPt->Fill(ePt)and the other by filling the same variable in a tree in another code.
std::vector<double> *electronPtarr;
myTree->Branch("ePt","vector<double>",&electronPtarr);
for(every event)
{
electronPtarr->clear();
electronPtarr->push_back(ePt);
myTree->Fill();
}
I have made sure that both (tree variable and histo )are filled under same conditions
When I plotted these two these are giving same no. of entries, same area and they look similar except for some very minor binning differences.
I am attaching the two plots and the corresponding .C files which show the bin by bin enteries.
plot_treevariable.C & plot_treevariable.gif : tree variable files
plot_histofill.C and plot_histofill.gif : histogram files
Is that minor difference expected?
Thanks & Regards,
Shilpi Jain
plot_treevariable.C (5.25 KB)
plot_histoFill.C (6.34 KB)
