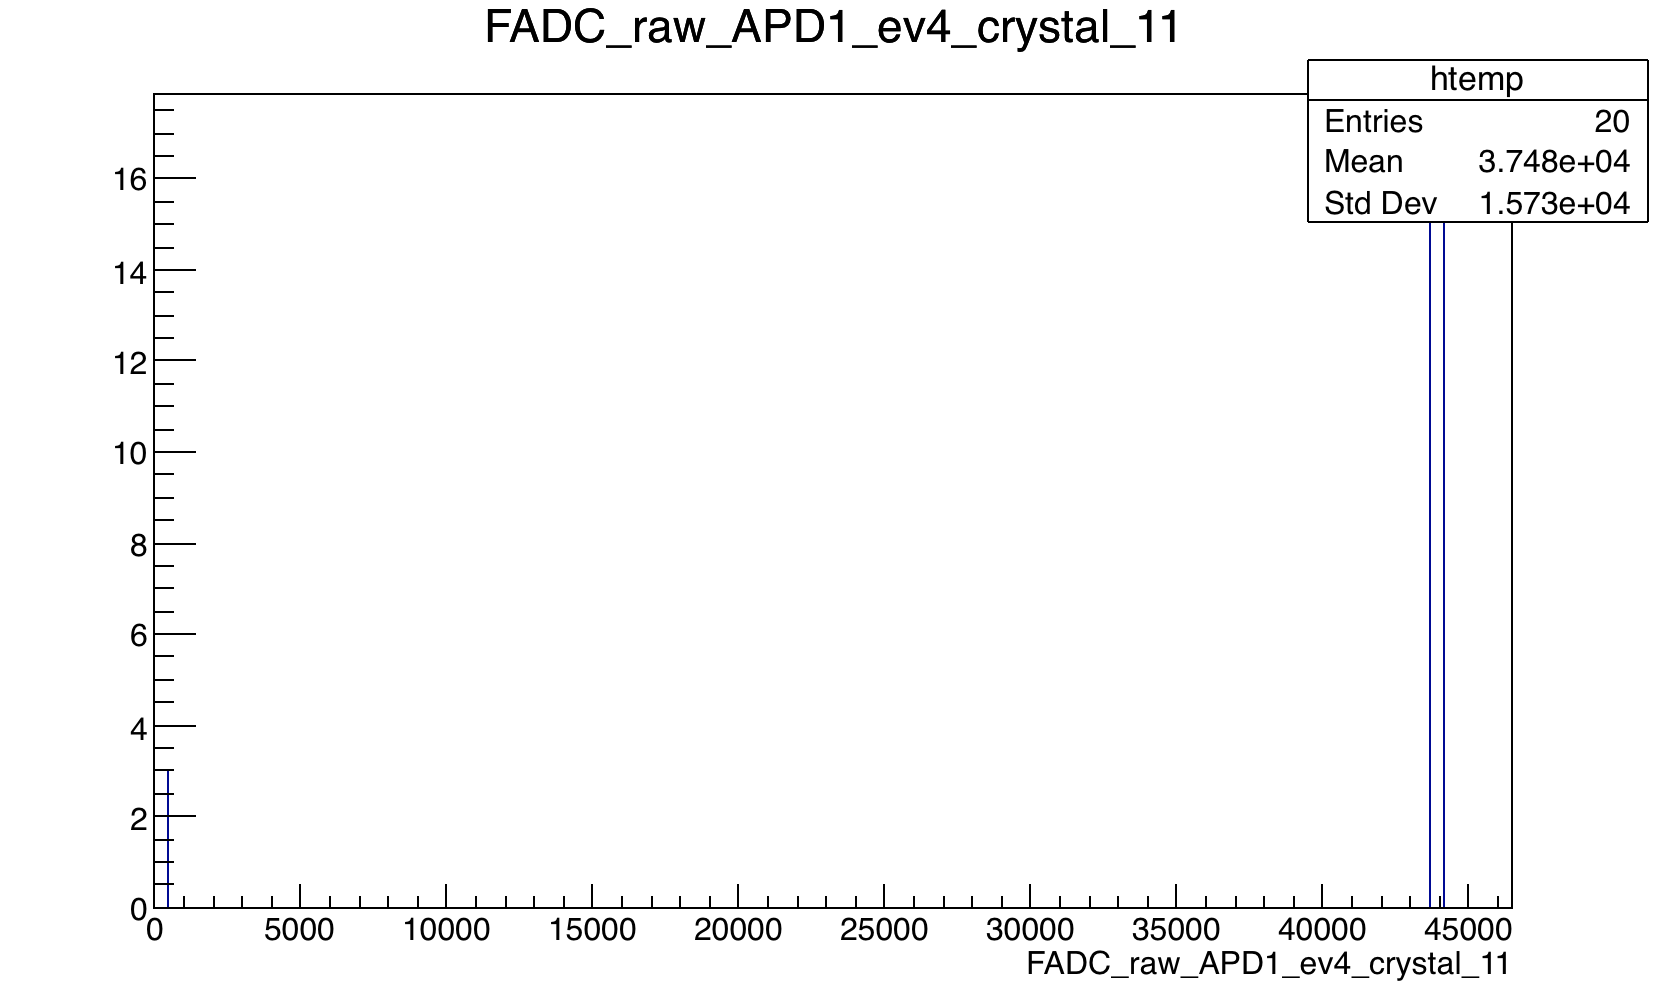
When I plot the data in anaTree/FADC_raw_APD1_ev4_crystal_11 I get the attached plot. That’s completely different … even the X axis range is different.
Right, so at the moment I’m trying to figure out what’s going on 
Ok … so I cannot help with that … That’s your data … you generate them …
Ok, thank you nevertheless!
Besides that do you have an idea how I do get rid of the mentioned error bars ?
This
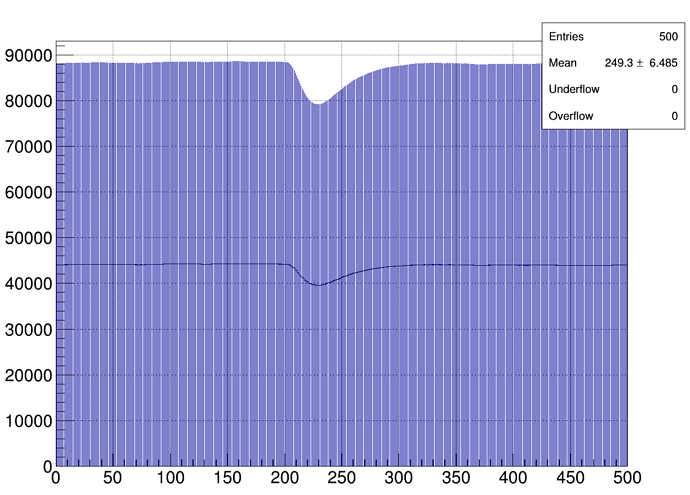
should look like
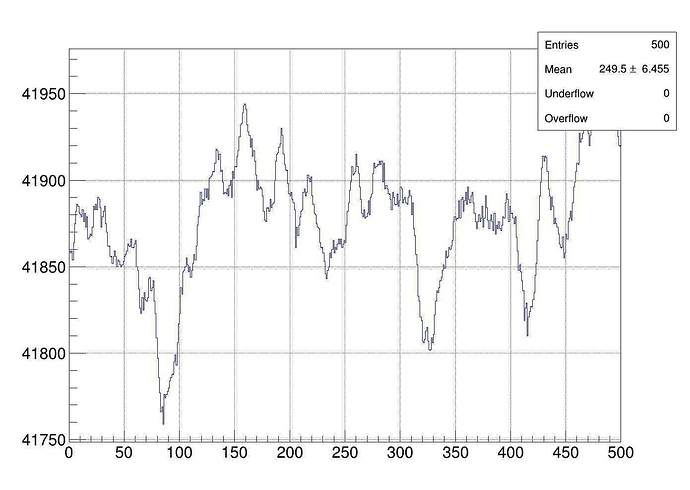
Despite the data points are not exactly the same the plotting should be!
These are histograms generated in aw_proto120_5times but they are not drawed. I look at them via the TBrowser and as long as there are no drawings I do not know how to change this.
just do:
$ root Filter_traces_array.root
   ----------------------------------------------------------------
  | Welcome to ROOT 6.09/03                    http://root.cern.ch |
  |                                   (c) 1995-2017, The ROOT Team |
  | Built for macosx64                                             |
  | From heads/master@v6-09-02-526-gde02310, Apr 24 2017, 17:40:20 |
  | Try '.help', '.demo', '.license', '.credits', '.quit'/'.q'     |
   ----------------------------------------------------------------

root [0]
Attaching file Filter_traces_array.root as _file0...
(TFile *) 0x7fded1eafa80
root [1] _file0->cd("raw_trace");
root [2] FADC_raw->Draw("hist");
and you will get:
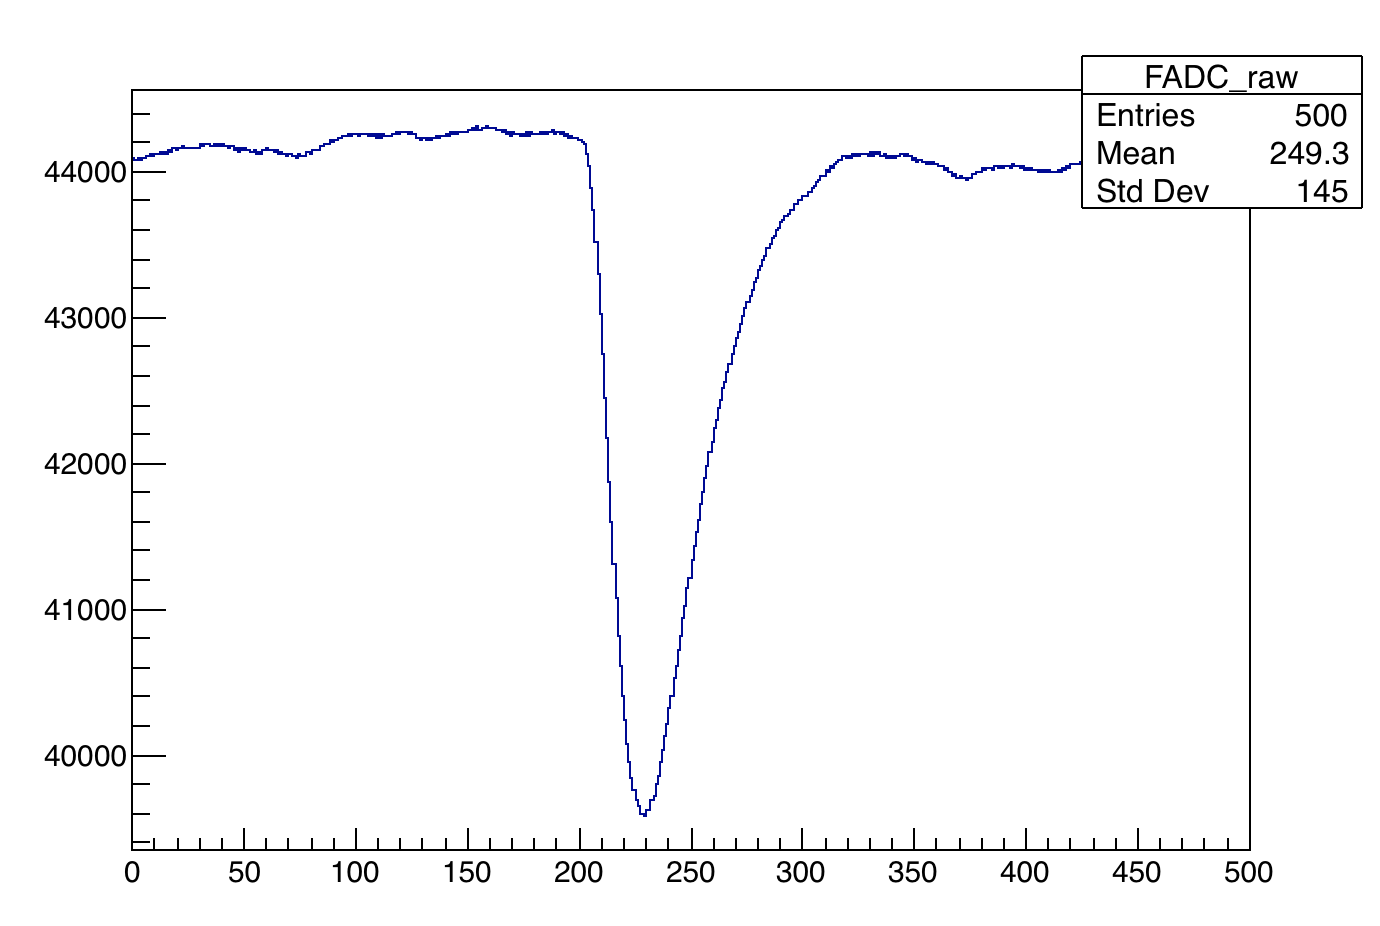
Yes, this is how it should look like!
How do I do this outside of the terminal / within the macro ?
The same way. You find in your macro where you Draw this histogram and you add the HIST option.
But I do not draw it, I just fill it.
Then via TBrowser I have a look at it.
>   	int TRACELEN = 500;
>   	hfile.mkdir ("raw_trace");
>   	hfile.cd ("raw_trace");

>   	TH1D *pFADC=new TH1D("FADC_raw","",TRACELEN,0,TRACELEN);
> 	pFADC->Draw("hist");
I tried it out nevertheless and I get a segmentation fault by adding the last line.
The error:
>  *** Break *** segmentation violation


> ===========================================================
> There was a crash.
> This is the entire stack trace of all threads:
> ===========================================================
> #0  0x00007ffbeccd654c in __libc_waitpid (pid=7033, stat_loc=stat_loc
> entry=0x7fff1578cc40, options=options
> entry=0) at ../sysdeps/unix/sysv/linux/waitpid.c:31
> #1  0x00007ffbecc58232 in do_system (line=<optimized out>) at ../sysdeps/posix/system.c:148
> #2  0x00007ffbee7d2853 in TUnixSystem::StackTrace (this=0x12cf8e0) at /home/ben/root-6.06.08/core/unix/src/TUnixSystem.cxx:2324
> #3  0x00007ffbee7d525c in TUnixSystem::DispatchSignals (this=0x12cf8e0, sig=kSigSegmentationViolation) at /home/ben/root-6.06.08/core/unix/src/TUnixSystem.cxx:3562
> #4  <signal handler called>
> #5  __memcpy_sse2_unaligned () at ../sysdeps/x86_64/multiarch/memcpy-sse2-unaligned.S:167
> #6  0x00007ffbed5b1148 in std::string::append(char const*, unsigned long) () from /usr/lib/x86_64-linux-gnu/libstdc++.so.6
> #7  0x00007ffbea1215e7 in llvm::raw_string_ostream::~raw_string_ostream() () from /home/ben/root/lib/libCling.so
> #8  0x00007ffbe8c39583 in TClingClassInfo::Name (this=<optimized out>) at /home/ben/root-6.06.08/core/meta/src/TClingClassInfo.cxx:1301
> #9  0x00007ffbe8c2cd57 in TClingBaseClassInfo::Name (this=this
> entry=0x7fff1578f510) at /home/ben/root-6.06.08/core/meta/src/TClingBaseClassInfo.cxx:563
> #10 0x00007ffbe8c02c78 in TCling::CreateListOfBaseClasses (this=<optimized out>, cl=0x2290aa0) at /home/ben/root-6.06.08/core/meta/src/TCling.cxx:3371
> #11 0x00007ffbee7a1204 in TClass::GetListOfBases (this=this
> entry=0x2290aa0) at /home/ben/root-6.06.08/core/meta/src/TClass.cxx:3479
> #12 0x00007ffbee70fb28 in TQObject::CollectClassSignalLists (this=this
> entry=0x16d2690, list=..., cls=0x2290aa0) at /home/ben/root-6.06.08/core/base/src/TQObject.cxx:458
> #13 0x00007ffbee7103f0 in TQObject::Emit (this=0x16d2690, signal_name=0x7ffbe2caaa02 "Closed()") at /home/ben/root-6.06.08/core/base/src/TQObject.cxx:564
> #14 0x00007ffbe2c79f74 in TCanvas::Destructor (this=this
> entry=0x16d2620) at /home/ben/root-6.06.08/graf2d/gpad/src/TCanvas.cxx:648
> #15 0x00007ffbe2c7cd20 in TCanvas::~TCanvas (this=0x16d2620, __in_chrg=<optimized out>) at /home/ben/root-6.06.08/graf2d/gpad/src/TCanvas.cxx:619
> #16 0x00007ffbe2c7cda9 in TCanvas::~TCanvas (this=0x16d2620, __in_chrg=<optimized out>) at /home/ben/root-6.06.08/graf2d/gpad/src/TCanvas.cxx:620
> #17 0x00007ffbee7669bd in TList::Delete (this=0x12d5790, option=<optimized out>) at /home/ben/root-6.06.08/core/cont/src/TList.cxx:460
> #18 0x00007ffbee65d224 in TROOT::EndOfProcessCleanups (this=0x7ffbeead69c0 <ROOT::Internal::GetROOT1()::alloc>) at /home/ben/root-6.06.08/core/base/src/TROOT.cxx:961
> #19 0x00007ffbecc4e1a9 in __run_exit_handlers (status=0, listp=0x7ffbecfd36c8 <__exit_funcs>, run_list_atexit=run_list_atexit
> entry=true) at exit.c:82
> #20 0x00007ffbecc4e1f5 in __GI_exit (status=<optimized out>) at exit.c:104
> #21 0x00007ffbecc33f4c in __libc_start_main (main=0x403fab <main(int, char**)>, argc=5, argv=0x7fff1578f8c8, init=<optimized out>, fini=<optimized out>, rtld_fini=<optimized out>, stack_end=0x7fff1578f8b8) at libc-start.c:321
> #22 0x0000000000403d09 in _start ()
> ===========================================================
And by using
>   	TH1D *pFADC=new TH1D("FADC_raw","",TRACELEN,0,TRACELEN);
> 	FADC_raw->Draw("hist");
following error occurs:
> aw_proto120_5times5.cxx:165:2: error: ‘FADC_raw’ was not declared in this scope
>   FADC_raw->Draw("hist");
>   ^
In browser put the option 'HIST" in the field for the “Draw option:”
Thanks again!
Sorry for disturbing but I have to have a look on the histograms a lot so typing “hist” every time is really time-consuming.
Is there another option ?
Why are there error bars ? As mentioned I do not use any draw options.
When histogram has error bars in tits structure it is by default plotted with errors bars. When the histogram is created you can do h->Sumw2(kFALSE) to avoid them. But I guess in your case it is too late as the histograms are already stored in a file.
Now if you use TBrowser the HIST option remains in the box … you do not have to type it each time you draw an histogram
Doesn’t work indeed. Interesting is, that this situation only occurs by using this one certain macro. And this in return did not happen before I used another macro. And besides of these both I do not have these problems… I guess somewhere has something been changed.
But anyhow, I stick with your solution. It’s not perfect but somehow almost
And above all thank you very much for your help!
I also figured out the problem I had with reading and writing with the tree. It was not a programming mistake but more a conceptional one as I had to try a lot when to fill in an array. However, at least in my case, it is completely different then filling in single values so I didn’t get behind this for so long.
Well, thanks a lot again!
This topic was automatically closed 14 days after the last reply. New replies are no longer allowed.