Hi,
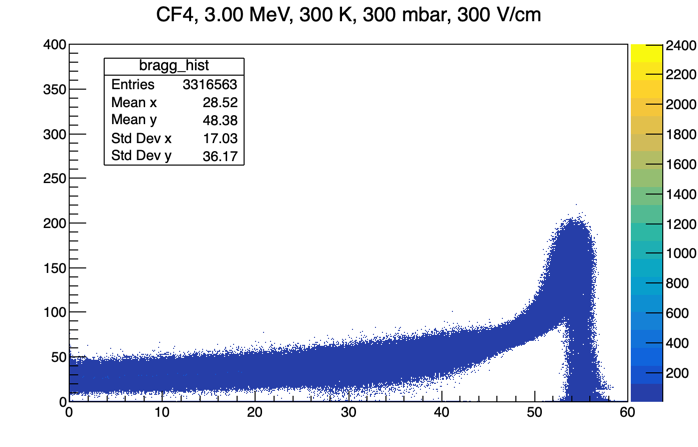
I am currently trying to analyze the energy loss of electrons in an active target gas. When I drew a 2D histogram with the ∆E/∆s versus ∑∆s (i.e. energy loss per step divided by the length of the step, versus the accumulated depth of the electron) I get the following histogram:
I don’t understand where this accumulation of points is coming from (it seems pretty unrealistic). Besides, the histogram seems to end sharply just above it. I do not know what is causing these effects
ROOT Version: 6.22/07 Platform: MacOS Compiler: Not Provided
true, both effects (the excess at 60 keV/mm and the cut-off at 75 keV/mm) look unrealistic. I’d suggest to check the code that produces your histogram.
    string str;
    while(getline(*file, str))

    {
        *file >> stepNumber >> Edep >> stepLength;

        stepNumbervec.push_back(stepNumber);
        Edepvec.push_back(Edep);
        stepLengthvec.push_back(stepLength);
    }


    TCanvas *c2 = new TCanvas("c2", "Bragg canvas");
    Int_t bragg_bins = 1000; // bins of histogram
    TH2F *bragg_hist = new TH2F("bragg_hist", Form("%s, %.2f MeV, %.0f K, %.0f mbar, %.0f V/cm", string(gas).c_str(), initial_energy, temperature, pressure, electric_field), bragg_bins, 0, 1400, bragg_bins, 0, 200);


    Double_t depth = 0; // accumulated depth
    Double_t stoppingPower;

    for(Int_t i=0; i<Edepvec.size(); i++)
    {
        if (stepNumbervec[i] != 1)
        {
            // stick to the same electron? -> add the step length to the total range
            depth += stepLengthvec[i];
            stoppingPower = Edepvec[i]*1000/stepLengthvec[i];
            c2->cd();
            bragg_hist->Fill(depth, stoppingPower);
        }
        else
        {
            // another electron? -> filling the last step of the previous one and clear depth
            c1->cd();
            range_hist->Fill(depth);
            depth = 0;
        }
    }

    c2->cd();
    //bragg_hist->Rebin2D(4, 4);
    bragg_hist->Draw("COLZ");
I didn’t upload it originally because it seemed pretty straightforward to me… The code reads a .txt file with the step number of the electron trajectory, the energy lost in that step and the length of the step, for example:
1 0.000125801 0.325053
2 0.0325084 74.1814
3 0.052952 120.936
4 0.0850733 226.414
5 0.0120996 31.1658
(where the second column is in MeV, and the third is in mm).
If you spot any problem please let me know. Otherwise I guess I will have to start looking at the Geant4 simulation that generates the file.
How large is this text file of yours? Can you post it here or maybe share it via your favorite file-sharing service like Dropbox/Google Drive/Mega etc.?
 . Thank you anyway for the help!