Please could you give me an example for how to show a tooltip for a JSROOT object (eg filled circle) on a TCanvas?
Is the “polar” drawing option supported for 2D histograms in JSROOT?
Please could you tell me how to replace a histogram’s Tooltip text? I found an example which suggests adding extra array elements, but I could not figure out how to add the extra information to each bin in the histogram, and also I would like to hide the x and y output.
No, “polar” draw option is not implemented for TH2 classes. I will add it to my to do list.
This will require some JavaScript programing. One can redefine TH2Painter::processTooltipEvent method to return some custom infos or just remove some lines.
Basic ROOT classes like TMarker or TEllipse does not have title, therefore tooltips handling does not implemented for them. One can use TGraph “p” draw option and modify tooltips handling there.
I will provide soon example how tooltip handler for some class can be modified.
And will try to implement “polar” draw option.
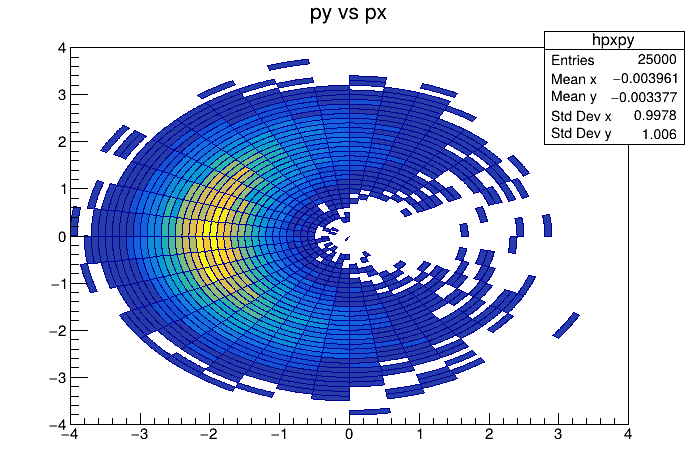
Yes, I am, one of my colleagues came up with a way to use it. We create a series of TH2s with increasing numbers of bins in x but only one bin in y, which is set to the desired radius. The first histogram has around 40 x bins with y (radius) = 6, and the last histogram has ~250 x bins with y (radius) = 25.
To display the histograms, we first draw an extra empty TH2 with colz to cover the whole range needed, and then use ‘pol same’ to draw the other histograms, each of them forms a ring. The end result is a flat 2D circle with the z scale showing the contents of each bin.
We have no interest in drawing it in 3D or as a lego plot to see different angles because it is an occupancy monitoring plot for a cylindrical detector and the flat 2D view is exactly what we need.
Thank you for the tooltip examples that you sent earlier, they look very helpful. I will have another go at this and get back to you.
In the master “pol” drawing was changed - while previous implementation had several problems.
Most prominent - it was wrongly drawing bins with negative Y values. Also it was impossible to reasonably show histograms which does not include (0,0) point in its range. Please check if new implementation fit to your needs.
Thanks very much for the help with the tooltips, the example was just what I needed.
I used a series of TGraphs with ‘P’ to draw the plot, I worked out the contour bands and then drew one graph per band, each in a different colour. Now I have a very nice looking JSROOT plot made from 254 graphs, and with mouseover tooltips.