Creating multiple objects in RDataFrame::Define

Hi,
As mentioned in https://sft.its.cern.ch/jira/browse/ROOT-9766, I’m trying to profile a potential bottleneck:

I’m looking for a solution which would work and scale well in case of a definition of N~1000 objects which are then filled to a vector of histograms.
The usecase is N systematics variations of a given observable which in my case is a triple differential cross section so filling vector of TH3D.
The proposed solution in the jira is to fill a vector of histograms at once with the Aggregate action, something like:

    ROOT::RDF::RResultPtr<ROOT::VecOps::RVec<TH3D>> output3D;
    output3D = DF->Define("SystVec",FillSystVector,{"SystBranch","EventWeight"}).Aggregate(Fill3DVec,add_vector3Dhistos,"SystVec",*hempty3DVec);

FillSystVector is a function which defines a vector of MyObject and Fill3DVec takes this vector and fills a correspoding histogram in a vector of histograms

Merger function:

auto add_vector3Dhistos = [] (ROOT::VecOps::RVec<TH3D> v1, ROOT::VecOps::RVec<TH3D> v2)
{
  for (int syst=0; syst<v1.size(); syst++)
    {
      v1[syst].Add(&(v2[syst]));
    }
  return v1;
};

Identity (not sure this is the most optimal way, it is adapted from previous/simpler usecase - the shared_ptr<ROOT::VecOps::RVec<TH3D>> is passed as identity to the Aggregate call

 ROOT::VecOps::RVec<ROOT::RDF::TH3DModel*> model3Dvec(nsyst);
 ROOT::VecOps::RVec<TH3D> hempty3Dvec(nsyst);
  for (int syst=0; syst<nsyst; syst++)
    {
      model3Dvec[syst] = new ROOT::RDF::TH3DModel(model3Dname.c_str(),model3Dname.c_str(),binsX.size()-1, &binsX[0], binsY.size()-1, &binsY[0], binsZ.size()-1, &binsZ[0]);
      hempty3Dvec[syst] = *(model3Dvec[syst]->GetHistogram());
    }
 std::shared_ptr<ROOT::VecOps::RVec<TH3D>> hempty3DVec=std::make_shared<ROOT::VecOps::RVec<TH3D>>(hempty3Dvec);

Performance-wise, it corresponds roughly 1500 TH3D (~200bins each) x 1-10 observables

I’m now investigating optimal running/bottlenecks:

  • Testing on 10M events in 16 input files, I get the most optimal running in 10 threads? (for example splitting to 25 threads (machine has 32 CPUs) almost doubles both Real Time and Cpu Time?)
  • In running on the 10 threads, I tried to see if RDataFrame is going to show any significant time spent with
  auto level =  ROOT::Experimental::ELogLevel::kDebug;
  auto verbosity = ROOT::Experimental::RLogScopedVerbosity(ROOT::Detail::RDF::RDFLogChannel(), level);
Initial JIT took about 2.2s then
Info in <[ROOT.RDF] Info /build/jenkins/workspace/lcg_release_pipeline/build/projects/ROOT-v6.24.00/src/ROOT/v6.24.00/tree/dataframe/src/
RLoopManager.cxx:670 in void ROOT::Detail::RDF::RLoopManager::Run()>: Finished event loop number 0 (24619.2s CPU, 2521.99s elapsed).
Total number of events: 10184588
Real Time = 3140.547s, Cpu Time = 25234.720s
Info in <[ROOT.RDF] Info /build/jenkins/workspace/lcg_release_pipeline/build/projects/ROOT-v6.24.00/src/ROOT/v6.24.00/tree/dataframe/src/
RLoopManager.cxx:613 in void ROOT::Detail::RDF::RLoopManager::Jit()>: Nothing to jit and execute.

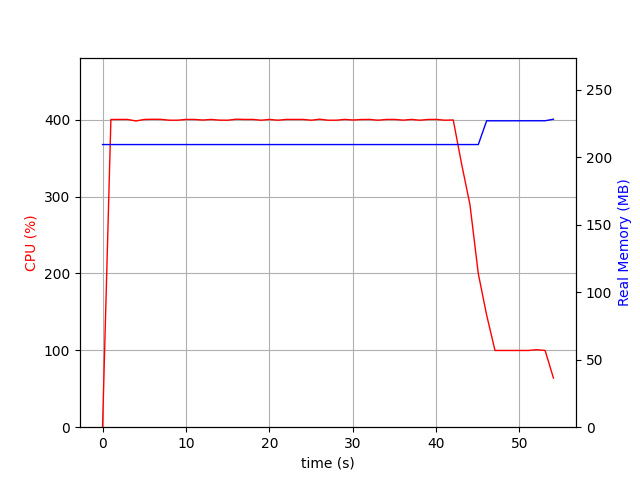
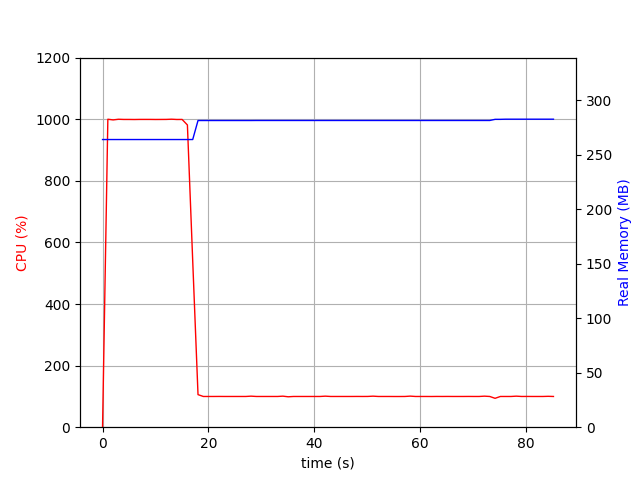
It seems there is a significant portion of time spent in postprocessing of the result - the difference between the 2521.99s shown by RDataFrame and Real Time = 3140.547s in my printout (see also attached psrecord:
psrecord_260721_syst10

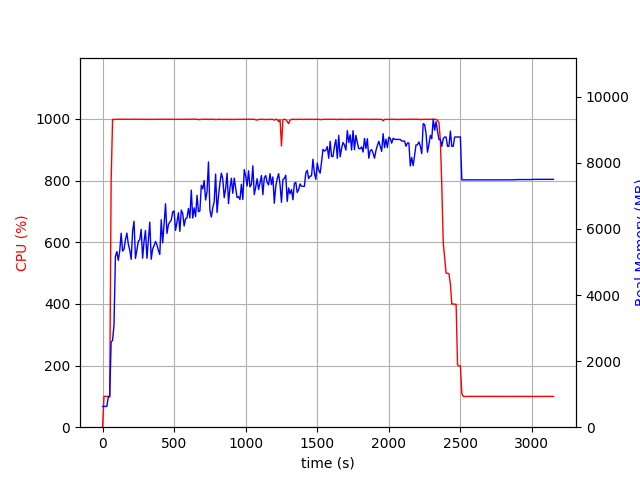
  • I’m thinking it’s the 10 CPUs x 1500 x 3 TH3D histograms getting merged together? Is there anything which could be improved (it seems to run only a single thread)

I also tried a profiller (vtune) - it seems that at the moment the most intensive part is TAxis::FindBin/TH3::Fill/TH2::Fill so there probably isn’t much about this part

Cheers,
Zdenek

_ROOT Version: 6.24
Platform: Not Provided
Compiler: Not Provided


Hi @zhubacek ,
alright, that should be faster than the version with 1000s of Defines, right?

Could you please share a minimal reproducer that I can run? I’d love to make flamegraphs for the run at 10 and at 32 cores to see what callstack is taking more time exactly. Also without a minimal working code I am not 100% sure I understand how things work exactly at the moment.

Minor optimization (not the bottleneck):

-auto add_vector3Dhistos = [] (ROOT::VecOps::RVec<TH3D> v1, ROOT::VecOps::RVec<TH3D> v2)
+auto add_vector3Dhistos = [] (ROOT::VecOps::RVec<TH3D> &v1, ROOT::VecOps::RVec<TH3D> &v2)

Cheers,
Enrico

P.S.
also, what’s the baseline? What evts/s rate is acceptable for filling 1000s of histograms from N threads?

Hi @eguiraud ,
Thanks! I will try to create a simpler reproducer (not sure how tricky it will be).

About the optimization - is this to avoid a copy? In the Aggregate documentation it says that the merger must be U(U,U) or void (std::vector<U>&) so I thought there is a difference between U and U& ?

I don’t have a clear baseline, I’m actually testing what could be possible/is achievable for the type of analysis with a huge number of systematics. I don’t understand what is going on in the last step of the psrecord graph in the initial post, if it is really merging the histograms from all threads? Because it seems to scale up with N_CPUs/there seems to be an optimal value where adding more CPUs is actually slowing the analysis (significantly) compared to running jobs in parallel (?)

Cheers,
Zdenek

Hi @eguiraud ,
Here is an minimal example - the dataframe has column1 column, an RVec<MyObject>, where the size of the vector corresponds to Nsyst systematics variations. I would like to fill Nsyst histograms; as I explained, my case is more complex so I can’t use a 2D histogram with Nsyst on y-axis, etc…

I fill the RVec<TH1D> with Aggregate which has add_vector1Dhisto as the merge and MyObjectFill as the aggregator function. The multiple define in this case is avoided here as the ObjectFill calls MyObject.vec.M() directly (one of possible variables of interest to be plotted)
it can be run with up to 3 parameters:

./rdf_systexample 4 1000000 1000
Setup: 4 CPUs, 1000000 events, 1000 vector size (systematics)

psrecord_rf020821_4_2
psrecord_rf020821_10
The psrecord for 4 (top) and 10 (bottom) cpus
Here is the code if I’m doing something which is not optimal:
rdf_systexample.cxx (2.6 KB)

Thanks,
Zdenek

Hi @zhubacek ,
thank you for the reproducer! I was off last week, will take a look asap.

Cheers,
Enrico

Hi @zhubacek ,
with the following definition of add_vector1Dhisto the runtime of ./rdf_systexample 10 1000000 1000, on my laptop, goes from ~15s to ~7s (compiling with -O2 optimizations):

void add_vector1Dhisto(std::vector<ROOT::VecOps::RVec<TH1D>> &results) {
   const auto nSysts = results[0].size();
   auto &hists0 = results[0];
   for (auto resIt = results.begin() + 1; resIt != results.end(); ++resIt) {
      for (int s = 0; s < nSysts; ++s) {
         hists0[s].Add(&resIt->at(s));
      }
   }
}

The problem with

auto add_vector1Dhisto = [](ROOT::VecOps::RVec<TH1D> v1, ROOT::VecOps::RVec<TH1D> v2)
{
  for (int isyst=0; isyst<v1.size(); isyst++)
    {
      v1[isyst].Add(&(v2[isyst]));
    }
  return v1;
};

is that, because you are taking arguments by value and returning the result by value, when merging the results of each thread, many TH1Ds are constructed, copied and destructed (and that’s a very expensive operation). I double-checked this is the case by running your code in gdb and stopping it several times during the single-thread tail of the execution. More threads → more merges to be done, which is why you saw the tail got longer with more threads.

With the new add_vector1Dhisto1, this is the performance profile: https://eguiraud.web.cern.ch/flamegraphs/forum_zhubacek_after.svg (see e.g. Flame Graphs for an explanation of the visualization – most of the time is now spent in TH1::Fill as expected).

You will also be happy to know that we are working on providing a nicer API to produce systematic variations of RDF results like you are doing here, stay tuned :slight_smile:

Cheers,
Enrico

Hi @eguiraud ,
Thanks!! Indeed, it seems that the merger of type void(std::vector<U>&) is much better.
Is there something like a rule of thumb or is it generally always better than U(U,U)?

Related - I’m also investigating what is the optimum number of threads vs number of events (for a particular ‘analysis setup’ - is there any possibility to time individual steps?

./rdf_systexample 10 1000000 1000 1
Setup: 10 CPUs, 1000000 events, 1000 vector size (systematics) merge type: 1
Timer: start : Mon Aug  9 21:14:34 2021
Timer: finish: Mon Aug  9 21:15:07 2021
Real Time =   33.299s, Cpu Time =  197.240s
./rdf_systexample 30 1000000 1000 1
Setup: 30 CPUs, 1000000 events, 1000 vector size (systematics) merge type: 1
Timer: start : Mon Aug  9 21:16:13 2021
Timer: finish: Mon Aug  9 21:17:55 2021
Real Time =  102.002s, Cpu Time =  377.420s

(this example with 10x more events will turn around and perform better on 30 threads for example)

Thanks,
Cheers,
Zdenek

Hi,
are you compiling with optimizations (e.g. -O2)?

The usual C++ guidelines apply, copies of non-trivial types are expensive.

You can do performance profiling with perf and e.g. produce a flamegraph like I did above to see where time is spent. I am a bit surprised that 3x more threads give you a 3x slowdown with the fix I shared above, can you share the new version of the code so I can run the same benchmark?

Cheers,
Enrico

Hi @eguiraud ,
I forgot about the -O2 (I don’t have a real makefile for the example, but a script which compiles executable with several optimization options and with different compilers), still I’m getting:

./rdf_systexampleO2 30 1000000 1000 1
Setup: 30 CPUs, 1000000 events, 1000 vector size (systematics) merge type: 1
Timer: start : Tue Aug 10 10:58:14 2021
Timer: finish: Tue Aug 10 10:59:19 2021
Real Time =   64.996s, Cpu Time =  120.820s
./rdf_systexampleO2 10 1000000 1000 1
Setup: 10 CPUs, 1000000 events, 1000 vector size (systematics) merge type: 1
Timer: start : Tue Aug 10 10:59:28 2021
Timer: finish: Tue Aug 10 10:59:42 2021
Real Time =   14.600s, Cpu Time =   45.280s

(gcc8.3 on AMD EPYC 7251 8-Core Processor (32 threads))
The code is essentially the same, I’ve added an extra switch for the merger function:
rdf_systexample.cxx (3.1 KB)

Cheers,
Zdenek

I see some time is spent in THashList::RecursiveRemove, i.e. ROOT garbage collection (which requires thread synchronization and that requires more work as the number of threads increases, because more threads == more histograms).

Try adding TH1::AddDirectory(false); at the very beginning of rdf_example. How do things look then?

Yes, this brings another huge improvement!

./rdf_systexampleO2 10 1000000 1000 1
Setup: 10 CPUs, 1000000 events, 1000 vector size (systematics) merge type: 1
Timer: start : Tue Aug 10 13:47:29 2021
Timer: finish: Tue Aug 10 13:47:36 2021
Real Time =    7.257s, Cpu Time =   36.350s
./rdf_systexampleO2 30 1000000 1000 1
Setup: 30 CPUs, 1000000 events, 1000 vector size (systematics) merge type: 1
Timer: start : Tue Aug 10 13:47:40 2021
Timer: finish: Tue Aug 10 13:47:45 2021
Real Time =    4.604s, Cpu Time =   58.790s

it actually seems to do more than the different merging function:

./rdf_systexampleO2 10 1000000 1000 0
Setup: 10 CPUs, 1000000 events, 1000 vector size (systematics) merge type: 0
Timer: start : Tue Aug 10 13:57:38 2021
Timer: finish: Tue Aug 10 13:57:45 2021
Real Time =    6.674s, Cpu Time =   35.060s
./rdf_systexampleO2 30 1000000 1000 0
Setup: 30 CPUs, 1000000 events, 1000 vector size (systematics) merge type: 0
Timer: start : Tue Aug 10 13:58:17 2021
Timer: finish: Tue Aug 10 13:58:23 2021
Real Time =    5.582s, Cpu Time =   56.630s

The important conclusion/summary is to use all 1) -O2 2) TH1::AddDirectory(false) and 3) merger of type void(std::vector<U>&)

Cheers,
Zdenek

1 Like

This topic was automatically closed 14 days after the last reply. New replies are no longer allowed.