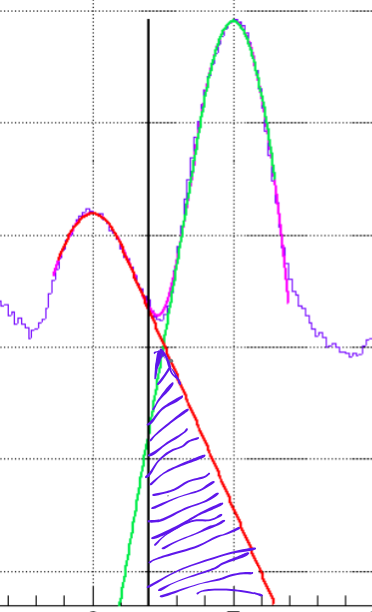
Hello, I’m trying to determine the number of counts of the histogram ‘hist’ within a specific region depicted in the attached figure. The green line in the figure represents the function TF1 * F, the red line corresponds to the function TF1 *G, and the black line is positioned at x = L.
My goal is to compute the counts within the shaded area (indicated by blue stripes; a quadrilateral, not a triangle). Although this is more of a mathematical problem than a ROOT-related one, any suggestions or guidance would be greatly appreciated. Thank you!
If the sides are straight enough for your goal, you can define a TCutG with the corners and use the Area() method of TCutG (scroll down on the same page).
Hi,
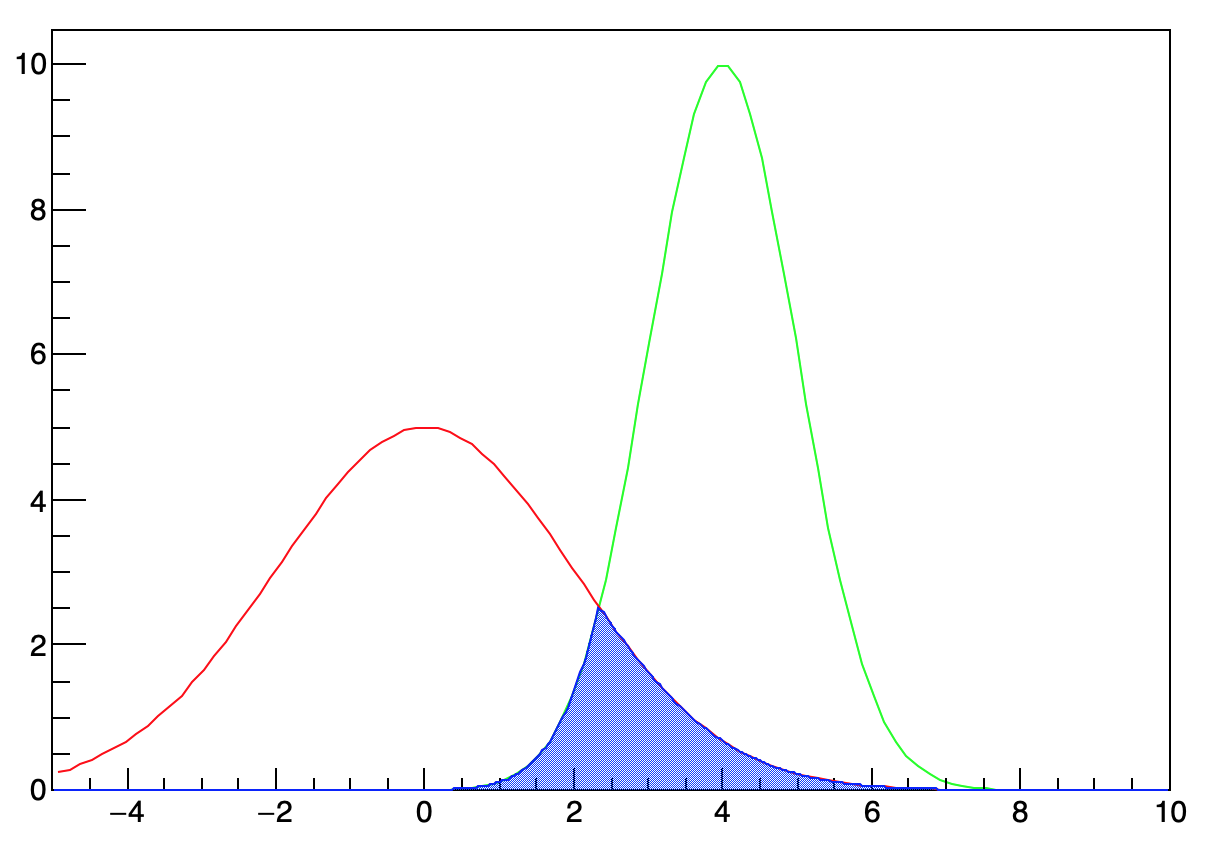
I just made a small example with 2 gauss functions F and G and then I defined a new piece-wise function.
The new function is defined as the larger one between F and G in the range. Then I simply use the TF1::Integral() method to compute the counts below the curve.