Hello,
I have a script which plots convolution of some model and gaussian response function.
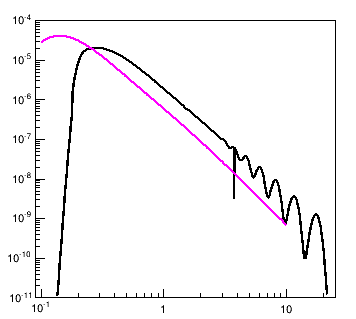
The final plot has some irregularities, see attachment. Also I am not entirely sure about the shift in the peak.
Could anyone shed some light on what could be the problem?
Thank you.
run code using
.L log_predicted_events.C+
log_predicted_events()
[code]#include “TF1.h”
#include “TMath.h”
#include “TCanvas.h”
#include “Math/Integrator.h”
TF1 *f1, *f2, *f3, *f_12, *f_123;
double Func_1(double *, double *);
double Func_2(double *, double *);
double Func_3(double *, double *);
double Func_12( double *, double * );
double Func_123( double *, double * );
double fConv_123( double *, double * );
void initializef3( TF1 *, double );
void log_predicted_events()
{
TCanvas *c1 = new TCanvas(“c1”, “”, 1200, 750 );
c1->Divide( 3, 2 );
f1 = new TF1(“f1”, Func_1, 0.05, 20, 2 );
f2 = new TF1(“f2”, Func_2, 0.05, 20, 10 );
f3 = new TF1(“f3”, Func_3, 0.05, 20, 2 );
f1->SetNpx(1000);
f2->SetNpx(1000);
f1->SetParameters( 1e-11, -3 );
f2->SetParameters( 4.73968, 0.329175, -0.129551, -0.463194, -0.0861036, 1.02192,
-0.614789, -0.155646, 0.208511, -0.0434517 );
initializef3( f3, 0.2 );
c1->cd(1);
f1->Draw();
f1->SetLineColor(4);
gPad->SetLogx(); gPad->SetLogy();
c1->cd(2);
f2->Draw();
gPad->SetLogx(); gPad->SetLogy();
f_12 = new TF1(“f_12”, Func_12, 0.05, 20, 1 );
f_12->SetNpx(1000);
f_12->SetParameter(0, 0);
c1->cd(3);
f_12->Draw();
f_12->SetLineColor(6);
gPad->SetLogx(); gPad->SetLogy();
f_123 = new TF1(“f_123”, Func_123, 0.05, 20, 1 );
f_123->SetNpx(1000);
f_123->SetParameter(0, 0);
c1->cd(4);
f3->Draw();
f3->SetLineColor(8);
c1->cd(5);
f_123->Draw();
f_12->Draw(“same”);
f_123->SetLineColor(kYellow+1);
gPad->SetLogx(); gPad->SetLogy();
TF1 *f_Conv = new TF1(“f_Conv”, fConv_123, 0.09, 25, 0 );
f_Conv->SetNpx(1000);
c1->cd(6);
f_Conv->Draw();
f_Conv->SetMinimum(1e-11);
f_Conv->SetMaximum(1e-4);
f_12->Draw(“same”);
f_Conv->SetLineColor(1);
gPad->SetLogx(); gPad->SetLogy();
//cout << f_Conv->Integral( 0.01, 40 ) << endl;
}
double Func_1(double *x, double *par)
{
double result;
if( x[0] > 0.1 && x[0] < 10 )
{
result = par[0]*pow( x[0], par[1] );
}
else result = 0;
return result;
}
double Func_2(double *x, double *par)
{
double result, logE;
logE = log10(x[0]);
result = pow(10,(par[0] + par[1]*logE + par[2]*pow(logE,2) + par[3]*pow(logE,3)
+ par[4]*pow(logE,4) + par[5]*pow(logE,5) + par[6]*pow(logE,6)
+ par[7]*pow(logE,7) + par[8]*pow(logE,8) + par[9]*pow(logE,9)));
if( x[0] < 0.1 || x[0] > 10 )
{
result = 0;
}
return result;
}
double Func_3(double x, double par)
{
double result;
result = exp(-0.5pow((x[0]-par[0]),2)/pow(par[1],2))/(sqrt(2TMath::Pi())*par[1]);
return result;
}
double Func_12( double *x, double *par )
{
return f1->Eval(x[0])*f2->Eval( x[0] );
}
double Func_123( double *x, double par )
{
double width = 0.15;
f3->SetNpx(1000);
f3->SetParameter( 0, x[0] );
f3->SetParameter( 1, widthx[0] );
f3->SetRange( pow(width,2)*x[0], x[0]/width/2 );
return f_12->Eval(x[0])*f3->Eval( par[0] - x[0] );
}
double fConv_123( double *x, double *par )
{
f_123->SetParameter(0, x[0]);
ROOT::Math::IntegratorOneDim *ig = new ROOT::Math::IntegratorOneDim( ROOT::Math::IntegrationOneDim::kADAPTIVE );
ig->SetFunction(*f_123);
return ig->Integral();
}
void initializef3( TF1* f3, double mean )
{
double width = 0.15;
f3->SetNpx(1000);
f3->SetParameter( 0, mean );
f3->SetParameter( 1, width*mean );
f3->SetRange( pow(width,2)*mean, mean/width/2 );
}[/code]
Red is the model, black is the convolution.