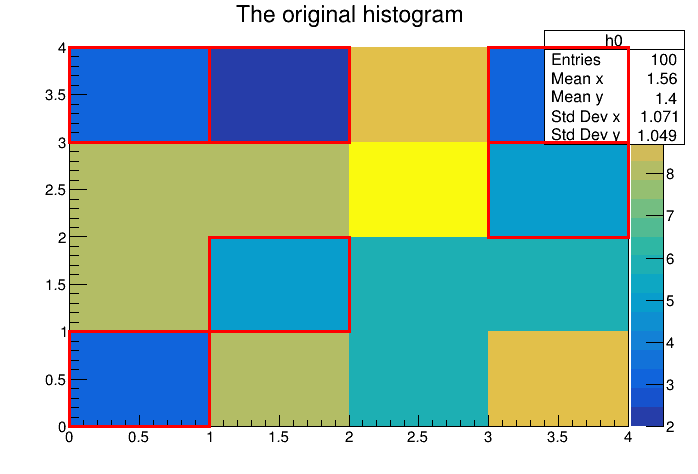
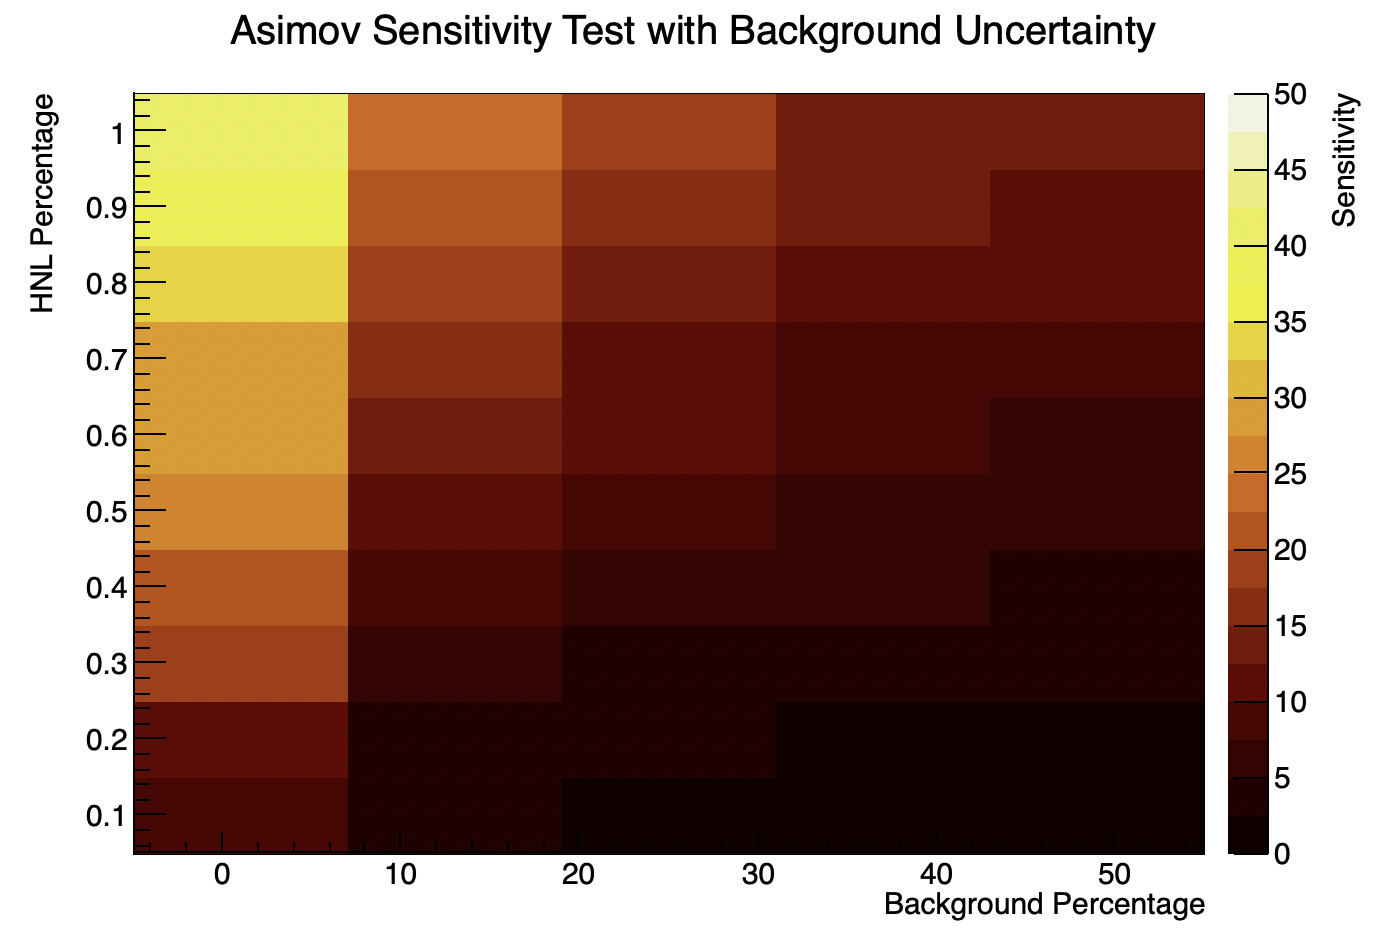
I am currently working on a project that requires me to draw a contour line over a 2d histogram in order to denote which bins are below a sensitivity of 5 and which are above. attached is an example of what my current 2d histogram looks like and I am filling these histograms using an array and a for loop.
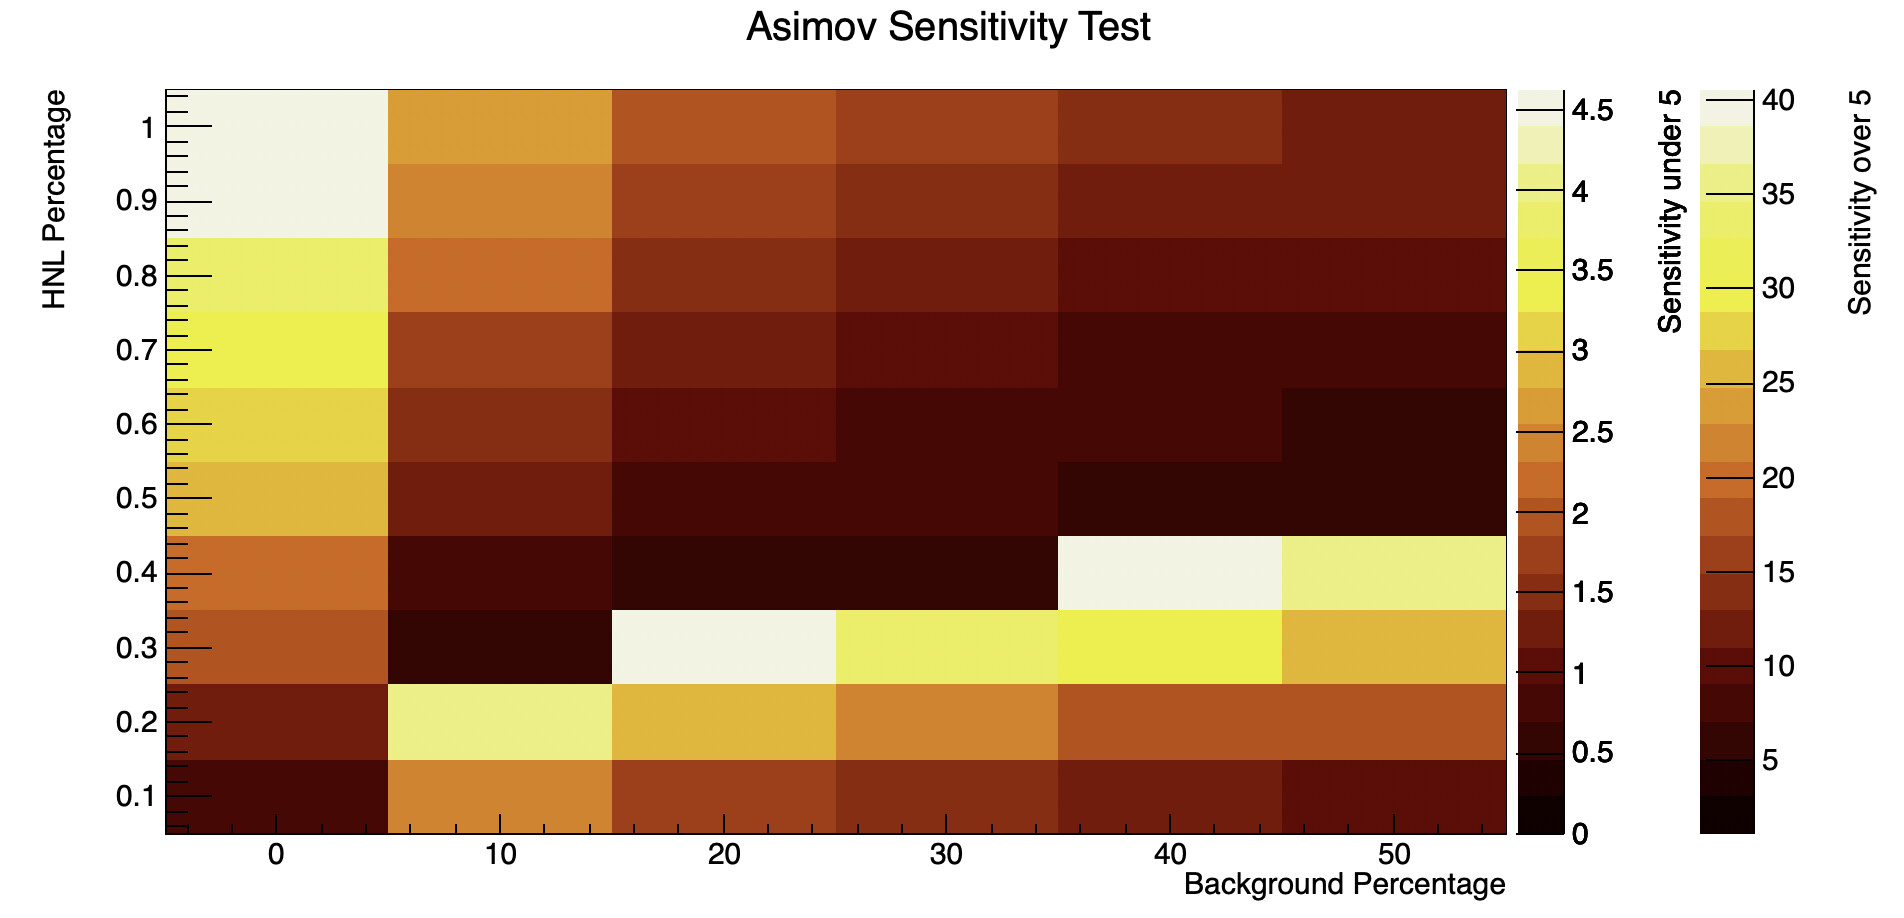
In an attempt to do something similar I created two separate histograms and used if statements to place bins in each separately an example of that is here:
   int j;
    int k;
    for(j = 0; j < 6; j++)
      {

	for(k = 0; k < 10; k++)
	  {
	    if (sens[(10*j)+k] <= 5)
		     {
	    h1->SetBinContent(j+1, k+1, sens[(10*j)+k]);
	    std::cout << "Bin # (" << j+1 << "," << k+1 << ") with values: (" << s[(10*j)+k] << "," << b[(10*j)+k] << "), Sensitivity = " << sens[(10*j)+k] << '\n';
		     }
	    else
	      {
	    h2->SetBinContent(j+1, k+1, sens[(10*j)+k]);
	    std::cout << "Bin # (" << j+1 << "," << k+1 << ") with values: (" << s[(10*j)+k] << "," << b[(10*j)+k] << "), Sensitivity = " << sens[(10*j)+k] << '\n';
	      }

	  }
here is my code for separating the values into two histograms.
For clarification I want to draw a solid line on my histogram that separates the bins that are less than 5 and those that are greater.
I also have already tried the contour line options in the 2d histogram section and I was unable to use them in the way I wanted to, but that could be due to my lack of understanding of them.